Estimated Value: $348,000 - $450,000
3
Beds
2
Baths
1,408
Sq Ft
$270/Sq Ft
Est. Value
About This Home
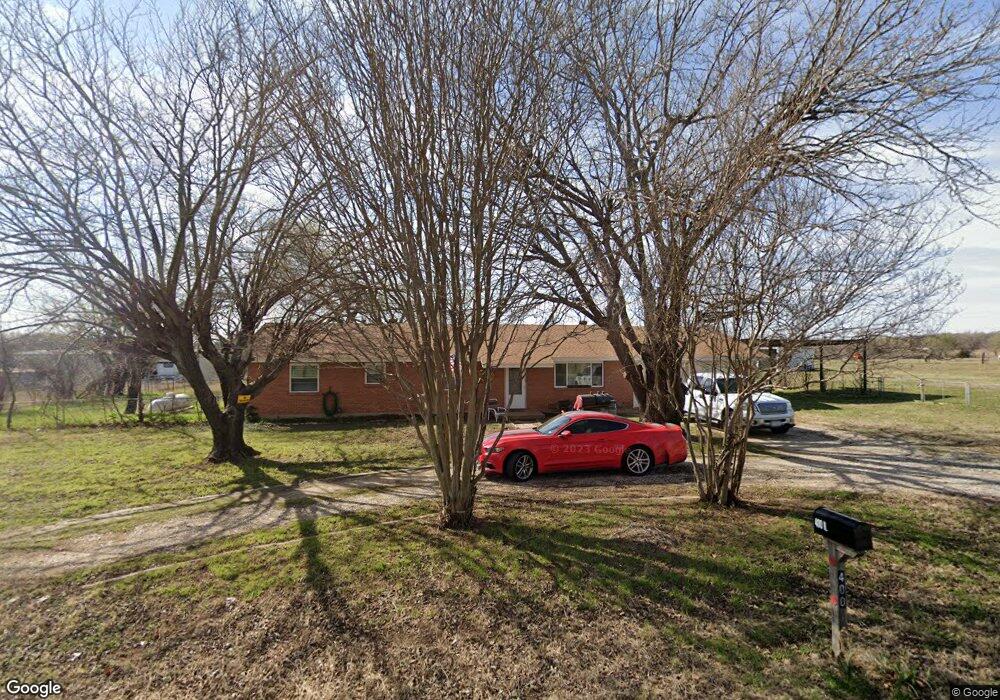
This home is located at 400 N Cardinal Rd, Azle, TX 76020 and is currently estimated at $379,595, approximately $269 per square foot. 400 N Cardinal Rd is a home located in Parker County with nearby schools including Springtown Reno Elementary School, Springtown Intermediate School, and Springtown Middle School.
Ownership History
Date
Name
Owned For
Owner Type
Purchase Details
Closed on
Jul 25, 2014
Sold by
Northern Sheila Dixon
Bought by
Webb Michael Lee and Webb Deborah Sue
Current Estimated Value
Home Financials for this Owner
Home Financials are based on the most recent Mortgage that was taken out on this home.
Original Mortgage
$20,000
Interest Rate
4.2%
Mortgage Type
Seller Take Back
Purchase Details
Closed on
Aug 28, 2006
Sold by
Cox Arthur Roen and Cox Lisa Ann
Bought by
Panzino Greg and Panzino Misty
Home Financials for this Owner
Home Financials are based on the most recent Mortgage that was taken out on this home.
Original Mortgage
$38,004
Interest Rate
6.72%
Mortgage Type
Purchase Money Mortgage
Purchase Details
Closed on
May 4, 1993
Bought by
Webb Michael Lee and Deborah Sue
Purchase Details
Closed on
Mar 30, 1993
Bought by
Webb Michael Lee and Deborah Sue
Purchase Details
Closed on
Oct 26, 1990
Bought by
Webb Michael Lee and Deborah Sue
Create a Home Valuation Report for This Property
The Home Valuation Report is an in-depth analysis detailing your home's value as well as a comparison with similar homes in the area
Home Values in the Area
Average Home Value in this Area
Purchase History
| Date | Buyer | Sale Price | Title Company |
|---|---|---|---|
| Webb Michael Lee | -- | Fnt | |
| Panzino Greg | -- | Stnt | |
| Webb Michael Lee | -- | -- | |
| Webb Michael Lee | -- | -- | |
| Webb Michael Lee | -- | -- |
Source: Public Records
Mortgage History
| Date | Status | Borrower | Loan Amount |
|---|---|---|---|
| Closed | Webb Michael Lee | $20,000 | |
| Previous Owner | Panzino Greg | $38,004 |
Source: Public Records
Tax History Compared to Growth
Tax History
| Year | Tax Paid | Tax Assessment Tax Assessment Total Assessment is a certain percentage of the fair market value that is determined by local assessors to be the total taxable value of land and additions on the property. | Land | Improvement |
|---|---|---|---|---|
| 2025 | $1,824 | $259,364 | -- | -- |
| 2024 | $1,824 | $235,785 | -- | -- |
| 2023 | $1,824 | $214,350 | $0 | $0 |
| 2022 | $4,192 | $208,880 | $100,000 | $108,880 |
| 2021 | $4,173 | $208,880 | $100,000 | $108,880 |
| 2020 | $3,784 | $197,000 | $99,750 | $97,250 |
| 2019 | $3,651 | $197,000 | $99,750 | $97,250 |
| 2018 | $3,328 | $143,700 | $67,830 | $75,870 |
| 2017 | $3,158 | $143,700 | $67,830 | $75,870 |
| 2016 | $2,871 | $110,000 | $45,230 | $64,770 |
| 2015 | $2,255 | $110,000 | $45,230 | $64,770 |
| 2014 | $2,382 | $92,570 | $40,570 | $52,000 |
Source: Public Records
Map
Nearby Homes
- 560 N Cardinal Rd
- 1001 Katie Ct
- 1012 Katie Ct
- 2001 Donna Ct
- 1300 Tiffany St
- 845 N Cardinal Rd
- 1633 Kay Ln
- TBD Nelson Rd
- 110 Tiffany Ct
- 934 Tiffany St
- 729 E Reno Rd
- 11870 Fm 730 N
- TBD Harris Rd
- 971 E Barry St
- 979 E Barry St
- 975 E Barry St
- TBD W Browder Cir
- 1920 Rhonda b Rd
- 3.760 acres Boyd Rd
- 3.78 acres Boyd Rd
- 365 N Cardinal Rd
- 330 N Cardinal Rd
- 450 N Cardinal Rd
- 455 N Cardinal Rd
- 1455 Reynolds Rd
- 335 N Cardinal Rd
- 1490 Reynolds Rd
- 230 S Cardinal Rd
- 235 N Cardinal Rd
- 1000 Katie Ct
- 230 N Cardinal Rd
- 1365 Reynolds Rd
- 493 N Cardinal Rd
- 1008 Katie Ct
- 1191 E Reno Rd
- 570 N Cardinal Rd
- 1009 Katie Ct
- 620 N Cardinal Rd
- 1190 E Reno Rd
- 1310 E Reno Rd