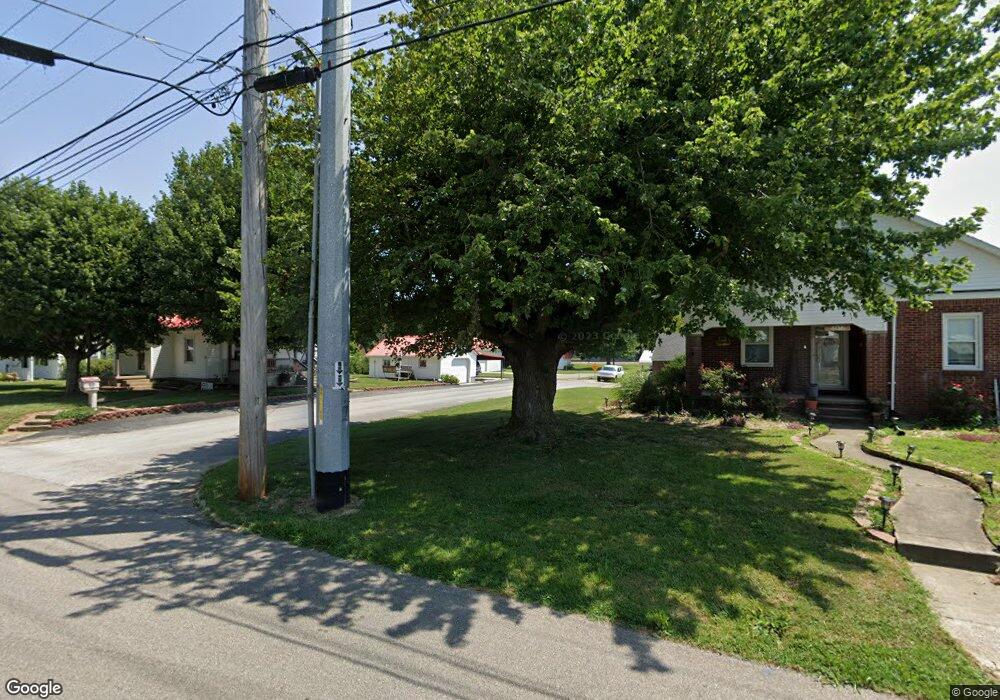
400 N West St Fort Branch, IN 47648
Estimated Value: $145,000 - $418,000
2
Beds
--
Bath
676
Sq Ft
$339/Sq Ft
Est. Value
About This Home
This home is located at 400 N West St, Fort Branch, IN 47648 and is currently estimated at $228,930, approximately $338 per square foot. 400 N West St is a home located in Gibson County with nearby schools including Gibson Southern High School and Holy Cross School.
Ownership History
Date
Name
Owned For
Owner Type
Purchase Details
Closed on
May 26, 2022
Sold by
Kiesel Leslie John and Kiesel Mary Colleen
Bought by
Rosey Farm Llc
Current Estimated Value
Purchase Details
Closed on
Feb 23, 2022
Sold by
Kathy Lloyd
Bought by
Kiesel Leslie John and Kiesel Mary Colleen
Purchase Details
Closed on
Mar 5, 2021
Sold by
Mason Gregory E and West Rebecca R
Bought by
Wem Farm Llc
Purchase Details
Closed on
Oct 8, 2012
Sold by
Newton Goldie
Bought by
William Mason
Purchase Details
Closed on
Jul 30, 2010
Sold by
Mary A Stclair
Bought by
William E Mason
Purchase Details
Closed on
Nov 18, 2008
Sold by
James E Mason
Bought by
William E Mason
Create a Home Valuation Report for This Property
The Home Valuation Report is an in-depth analysis detailing your home's value as well as a comparison with similar homes in the area
Home Values in the Area
Average Home Value in this Area
Purchase History
| Date | Buyer | Sale Price | Title Company |
|---|---|---|---|
| Rosey Farm Llc | -- | Druley Ray M | |
| Kiesel Leslie John | -- | None Listed On Document | |
| Wem Farm Llc | -- | None Available | |
| William Mason | $4,000 | Law Office Of Ray Druley | |
| Mason William | $4,000 | Law Office Of Ray Druley | |
| William E Mason | $24,000 | Law Office Of Ray Druley | |
| William E Mason | $9,300 | -- |
Source: Public Records
Tax History Compared to Growth
Tax History
| Year | Tax Paid | Tax Assessment Tax Assessment Total Assessment is a certain percentage of the fair market value that is determined by local assessors to be the total taxable value of land and additions on the property. | Land | Improvement |
|---|---|---|---|---|
| 2024 | $429 | $27,300 | $23,700 | $3,600 |
| 2023 | $423 | $24,700 | $19,700 | $5,000 |
| 2022 | $267 | $16,100 | $15,600 | $500 |
| 2021 | $246 | $13,800 | $13,400 | $400 |
| 2020 | $263 | $13,700 | $13,300 | $400 |
| 2019 | $305 | $16,600 | $16,200 | $400 |
| 2018 | $318 | $17,100 | $16,700 | $400 |
| 2017 | $333 | $19,600 | $19,200 | $400 |
| 2016 | $345 | $20,800 | $20,400 | $400 |
| 2014 | $334 | $21,300 | $21,300 | $0 |
| 2013 | -- | $18,300 | $18,300 | $0 |
Source: Public Records
Map
Nearby Homes
- 403 N West St
- 512 N Polk St
- 211 W Locust St Unit 2
- 203 W Locust St
- 104 E Vine St
- 404 N Church St
- 209 S Main St
- 806 E Park St
- 603 E Park St
- 203 S Willard St
- 106 E Oak St
- 504 S Center St
- 708 E Park St
- 703 S Center St
- 1012 S Center St
- 6000 S Us Hwy 41 N
- 10160 S Quail Crossing
- 102 S West St
- 115 S Weber Dr
- 301 S 4th Ave