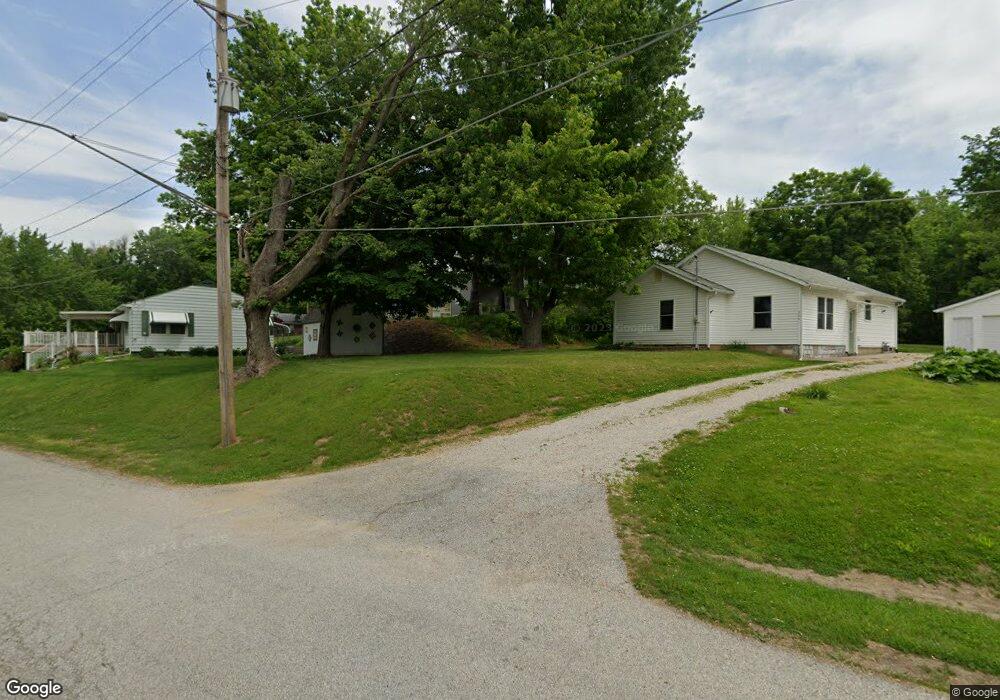
400 Oak Blvd Port Byron, IL 61275
Estimated Value: $109,206 - $145,000
--
Bed
--
Bath
992
Sq Ft
$127/Sq Ft
Est. Value
About This Home
This home is located at 400 Oak Blvd, Port Byron, IL 61275 and is currently estimated at $125,802, approximately $126 per square foot. 400 Oak Blvd is a home located in Rock Island County with nearby schools including Riverdale Elementary School, Riverdale Middle School, and Riverdale Senior High School.
Ownership History
Date
Name
Owned For
Owner Type
Purchase Details
Closed on
Mar 6, 2020
Sold by
Vanznyt Sharon R and Vanznyt Richard L
Bought by
Ford Isaiah Allen and Ford Dennis
Current Estimated Value
Home Financials for this Owner
Home Financials are based on the most recent Mortgage that was taken out on this home.
Original Mortgage
$78,551
Outstanding Balance
$69,699
Interest Rate
3.6%
Mortgage Type
FHA
Estimated Equity
$56,103
Create a Home Valuation Report for This Property
The Home Valuation Report is an in-depth analysis detailing your home's value as well as a comparison with similar homes in the area
Home Values in the Area
Average Home Value in this Area
Purchase History
| Date | Buyer | Sale Price | Title Company |
|---|---|---|---|
| Ford Isaiah Allen | $80,000 | Winstein Kavensky & Cunningham |
Source: Public Records
Mortgage History
| Date | Status | Borrower | Loan Amount |
|---|---|---|---|
| Open | Ford Isaiah Allen | $78,551 |
Source: Public Records
Tax History Compared to Growth
Tax History
| Year | Tax Paid | Tax Assessment Tax Assessment Total Assessment is a certain percentage of the fair market value that is determined by local assessors to be the total taxable value of land and additions on the property. | Land | Improvement |
|---|---|---|---|---|
| 2024 | $2,309 | $36,439 | $8,567 | $27,872 |
| 2023 | $2,309 | $33,431 | $7,860 | $25,571 |
| 2022 | $2,131 | $33,072 | $7,496 | $25,576 |
| 2021 | $2,058 | $31,348 | $7,105 | $24,243 |
| 2020 | $1,116 | $30,885 | $7,000 | $23,885 |
| 2019 | $1,100 | $30,885 | $7,000 | $23,885 |
| 2018 | $1,100 | $29,119 | $4,866 | $24,253 |
| 2017 | $1,429 | $29,119 | $4,866 | $24,253 |
| 2016 | $1,404 | $28,717 | $4,799 | $23,918 |
| 2015 | $1,311 | $27,387 | $4,576 | $22,811 |
| 2014 | $299 | $26,850 | $4,486 | $22,364 |
| 2013 | $299 | $26,850 | $4,486 | $22,364 |
Source: Public Records
Map
Nearby Homes