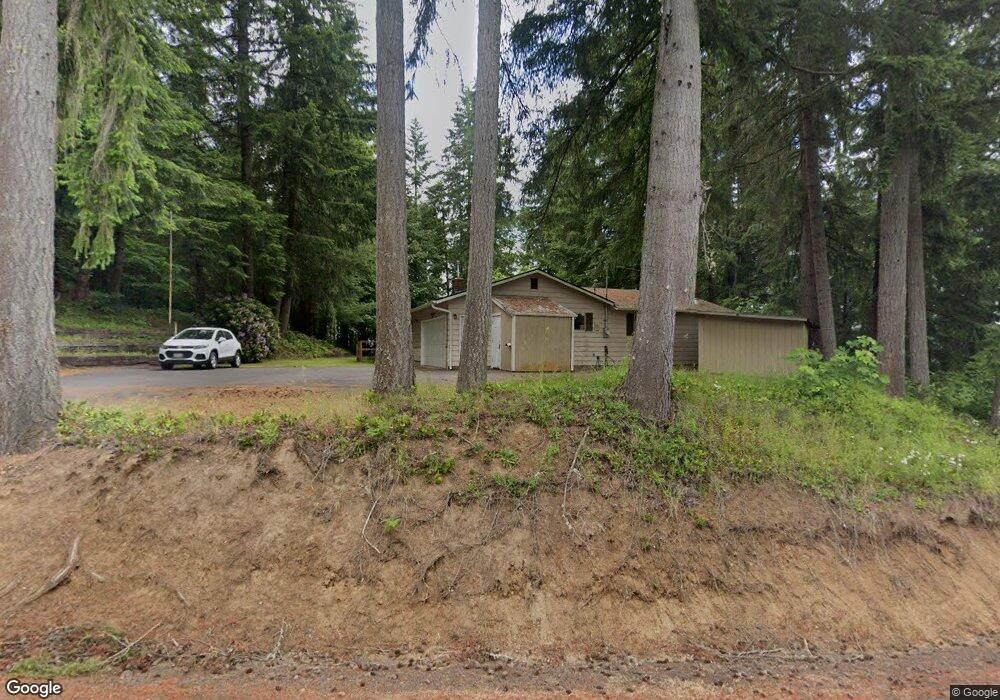
400 Ogden Rd Castle Rock, WA 98611
Estimated Value: $406,000 - $433,000
3
Beds
2
Baths
1,524
Sq Ft
$276/Sq Ft
Est. Value
About This Home
This home is located at 400 Ogden Rd, Castle Rock, WA 98611 and is currently estimated at $420,767, approximately $276 per square foot. 400 Ogden Rd is a home located in Cowlitz County with nearby schools including Castle Rock Elementary School, Castle Rock Middle School, and Castle Rock High School.
Ownership History
Date
Name
Owned For
Owner Type
Purchase Details
Closed on
Jul 14, 2025
Sold by
Tomlinson Kenneth James
Bought by
Dreammaker Investments Llc
Current Estimated Value
Home Financials for this Owner
Home Financials are based on the most recent Mortgage that was taken out on this home.
Original Mortgage
$302,800
Outstanding Balance
$302,287
Interest Rate
6.85%
Mortgage Type
New Conventional
Estimated Equity
$118,480
Purchase Details
Closed on
Apr 17, 2025
Sold by
Tomlinson Kenneth
Bought by
Cash Is King Llc
Purchase Details
Closed on
Dec 2, 2009
Sold by
Burkhartt Arlotte B
Bought by
Tomlinson Kenneth James
Home Financials for this Owner
Home Financials are based on the most recent Mortgage that was taken out on this home.
Original Mortgage
$151,190
Interest Rate
4.99%
Mortgage Type
FHA
Purchase Details
Closed on
Oct 9, 2007
Sold by
Burkhartt Arlotte B
Bought by
Burkhartt Arlotte B
Create a Home Valuation Report for This Property
The Home Valuation Report is an in-depth analysis detailing your home's value as well as a comparison with similar homes in the area
Home Values in the Area
Average Home Value in this Area
Purchase History
| Date | Buyer | Sale Price | Title Company |
|---|---|---|---|
| Dreammaker Investments Llc | $265,000 | Wfg National Title | |
| Cash Is King Llc | -- | None Listed On Document | |
| Tomlinson Kenneth James | $156,400 | Cascade | |
| Burkhartt Arlotte B | -- | None Available |
Source: Public Records
Mortgage History
| Date | Status | Borrower | Loan Amount |
|---|---|---|---|
| Open | Dreammaker Investments Llc | $302,800 | |
| Previous Owner | Tomlinson Kenneth James | $151,190 |
Source: Public Records
Tax History Compared to Growth
Tax History
| Year | Tax Paid | Tax Assessment Tax Assessment Total Assessment is a certain percentage of the fair market value that is determined by local assessors to be the total taxable value of land and additions on the property. | Land | Improvement |
|---|---|---|---|---|
| 2024 | $2,940 | $349,600 | $61,210 | $288,390 |
| 2023 | $2,701 | $374,880 | $61,210 | $313,670 |
| 2022 | $2,345 | $332,380 | $61,210 | $271,170 |
| 2021 | $2,118 | $260,690 | $61,210 | $199,480 |
| 2020 | $2,197 | $228,590 | $53,220 | $175,370 |
| 2019 | $1,892 | $246,103 | $52,229 | $193,874 |
| 2018 | $2,061 | $208,580 | $52,230 | $156,350 |
| 2017 | $1,710 | $196,650 | $49,740 | $146,910 |
| 2016 | $1,517 | $164,770 | $47,370 | $117,400 |
| 2015 | $1,486 | $156,960 | $47,370 | $109,590 |
| 2013 | -- | $154,170 | $44,890 | $109,280 |
Source: Public Records
Map
Nearby Homes
- 121 Gassman Rd
- 143 Annabelle St
- 155 Gassman Rd
- 130 Annabelle St
- 153 Green Acres Dr
- 642 5th Ave SW
- 5780 Westside Hwy
- 546 4th Ave SW
- 114 Cherry St NW
- 237 C St SW
- 6609 Westside Hwy
- 385 Front Ave NW
- 1020 3rd Ave SW
- 705 1st Ave SW
- 438 Front Ave SW
- 1 D St SW
- 56 Shear St SW
- 203 Roake Ave SE
- 107 Guinevere Ct