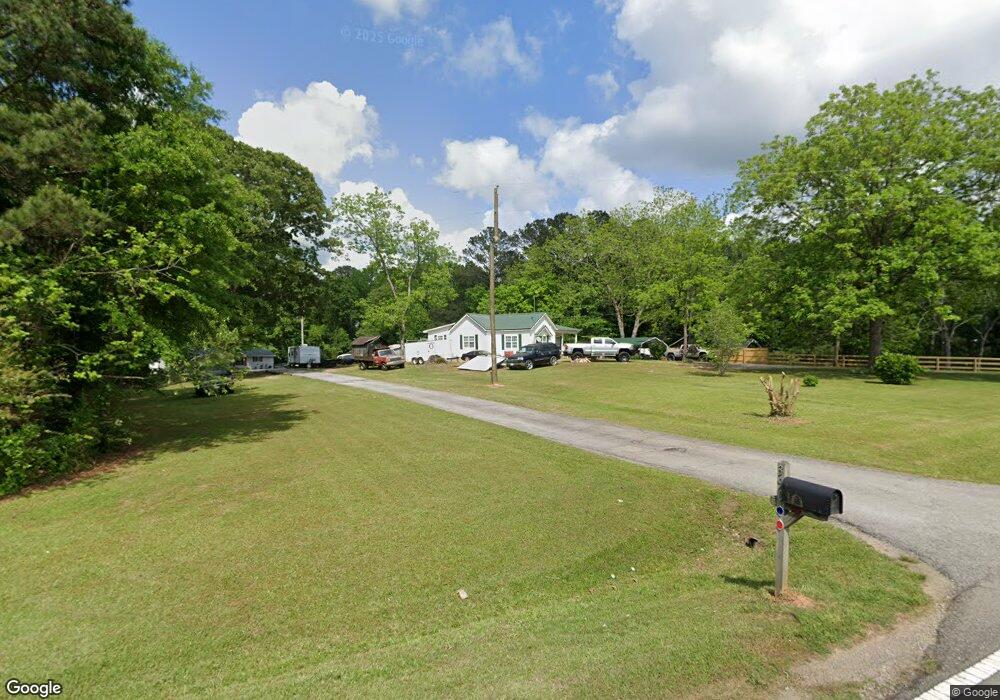
400 Old Airport Rd Carrollton, GA 30116
Abilene NeighborhoodEstimated Value: $224,439 - $243,000
3
Beds
2
Baths
1,437
Sq Ft
$163/Sq Ft
Est. Value
About This Home
This home is located at 400 Old Airport Rd, Carrollton, GA 30116 and is currently estimated at $234,110, approximately $162 per square foot. 400 Old Airport Rd is a home located in Carroll County with nearby schools including Sharp Creek Elementary School, Bay Springs Middle School, and Villa Rica High School.
Ownership History
Date
Name
Owned For
Owner Type
Purchase Details
Closed on
Jan 11, 2013
Sold by
Johnson Willie M
Bought by
Vaughn Willie M
Current Estimated Value
Purchase Details
Closed on
Aug 26, 2011
Sold by
Johnson Cornell
Bought by
Johnson Wille Mae
Purchase Details
Closed on
Oct 15, 2010
Sold by
Mack Charles S
Bought by
Johnson Cornell
Purchase Details
Closed on
Jun 19, 2006
Sold by
Not Provided
Bought by
Johnson Cornell and Johnson Wille Mae
Purchase Details
Closed on
Mar 7, 2006
Sold by
Welch Keith J
Bought by
Bank Of New York
Purchase Details
Closed on
Jul 26, 1993
Sold by
Davis Margaret
Bought by
Welch Keith
Purchase Details
Closed on
Jun 24, 1992
Sold by
Robins Magaret L
Bought by
Davis Margaret
Purchase Details
Closed on
Mar 16, 1992
Sold by
Robins
Bought by
Robins Magaret L
Purchase Details
Closed on
Oct 23, 1990
Bought by
Robins
Create a Home Valuation Report for This Property
The Home Valuation Report is an in-depth analysis detailing your home's value as well as a comparison with similar homes in the area
Home Values in the Area
Average Home Value in this Area
Purchase History
| Date | Buyer | Sale Price | Title Company |
|---|---|---|---|
| Vaughn Willie M | -- | -- | |
| Johnson Wille Mae | -- | -- | |
| Johnson Cornell | $86,000 | -- | |
| Johnson Cornell | $30,000 | -- | |
| Bank Of New York | $33,750 | -- | |
| Welch Keith | $38,000 | -- | |
| Davis Margaret | -- | -- | |
| Robins Magaret L | -- | -- | |
| Robins | $45,700 | -- |
Source: Public Records
Tax History Compared to Growth
Tax History
| Year | Tax Paid | Tax Assessment Tax Assessment Total Assessment is a certain percentage of the fair market value that is determined by local assessors to be the total taxable value of land and additions on the property. | Land | Improvement |
|---|---|---|---|---|
| 2024 | $1,535 | $67,860 | $6,000 | $61,860 |
| 2023 | $1,476 | $62,369 | $6,000 | $56,369 |
| 2022 | $1,285 | $51,222 | $6,000 | $45,222 |
| 2021 | $1,153 | $44,992 | $6,000 | $38,992 |
| 2020 | $95 | $40,256 | $6,000 | $34,256 |
| 2019 | $621 | $37,328 | $6,000 | $31,328 |
| 2018 | $501 | $30,344 | $6,000 | $24,344 |
| 2017 | $503 | $30,344 | $6,000 | $24,344 |
| 2016 | $567 | $35,724 | $6,000 | $29,724 |
| 2015 | $466 | $21,102 | $6,000 | $15,102 |
| 2014 | $468 | $21,102 | $6,000 | $15,102 |
Source: Public Records
Map
Nearby Homes
- 0 Old Airport Rd Unit 10599783
- 0 Old Airport Rd Unit 10599779
- 0 Old Airport Rd Unit 10599776
- 0 Old Airport Rd Unit 7642336
- 22 Summer Ct
- 0 Knight Dr W
- 180 Old Airport Rd
- 367 Frashier Rd
- 206 Asher Dr
- The Ellison II Plan at Jameson Towns
- The Norwood II Plan at Jameson Towns
- The Maddux II Plan at Jameson Towns
- 00 Old Airport Rd
- 255 Morgan Rd
- 0 Shady Grove Rd Unit 10601173
- 0 Shady Grove Rd Unit 10601172
- 1890 Shady Grove Rd
- 1866 Shady Grove Rd
- 47 Quail Hollow Dr
- 110 Stoney Brook Dr
- 414 Old Airport Rd
- 390 Old Airport Rd
- 0 Old Airport Rd Unit 8258302
- 0 Old Airport Rd Unit 7324726
- 0 Old Airport Rd Unit 7018405
- 0 Old Airport Rd Unit 9028377
- 0 Old Airport Rd Unit 9043687
- 0 Old Airport Rd Unit 8742119
- 0 Old Airport Rd Unit 8273475
- 0 Old Airport Rd Unit 8897231
- 0 Old Airport Rd Unit 8903924
- 0 Old Airport Rd Unit 8849897
- 0 Old Airport Rd Unit 3183006
- 0 Old Airport Rd Unit 7337783
- 0 Old Airport Rd Unit 7399513
- 0 Old Airport Rd Unit 7433069
- 0 Old Airport Rd Unit 7535543
- 0 Old Airport Rd Unit 8207486
- 0 Old Airport Rd Unit 8212236
- 0 Old Airport Rd Unit 8237827