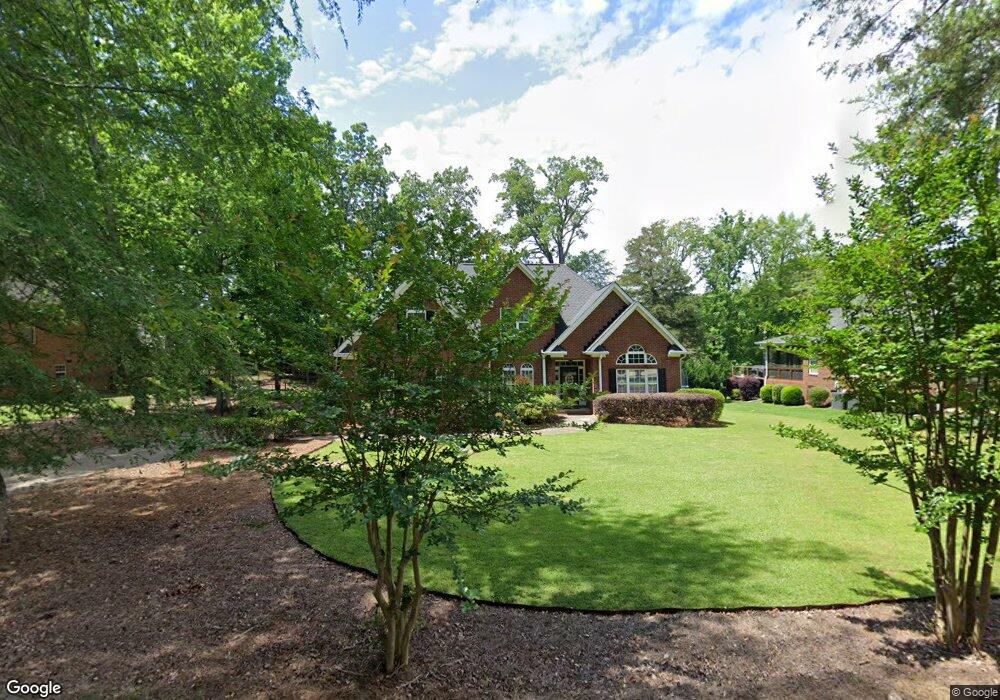
400 Old Forge Rd Chapin, SC 29036
Estimated Value: $420,117 - $528,000
3
Beds
3
Baths
2,047
Sq Ft
$228/Sq Ft
Est. Value
About This Home
This home is located at 400 Old Forge Rd, Chapin, SC 29036 and is currently estimated at $467,279, approximately $228 per square foot. 400 Old Forge Rd is a home located in Lexington County with nearby schools including Lake Murray Elementary School, Chapin Intermediate, and Chapin High School.
Ownership History
Date
Name
Owned For
Owner Type
Purchase Details
Closed on
Oct 26, 2015
Sold by
Culler Willis C and Culler Laura H
Bought by
Culler Willis C and Culler Laura H
Current Estimated Value
Purchase Details
Closed on
Mar 17, 2006
Sold by
Watson Raymond J
Bought by
Culler Willis C and Culler Laura H
Home Financials for this Owner
Home Financials are based on the most recent Mortgage that was taken out on this home.
Original Mortgage
$235,980
Outstanding Balance
$133,996
Interest Rate
6.25%
Mortgage Type
Future Advance Clause Open End Mortgage
Estimated Equity
$333,283
Purchase Details
Closed on
Jul 11, 2005
Sold by
Parker Hugh L and Parker Betty H
Bought by
Watson Raymond J
Home Financials for this Owner
Home Financials are based on the most recent Mortgage that was taken out on this home.
Original Mortgage
$206,500
Interest Rate
5.46%
Mortgage Type
Purchase Money Mortgage
Create a Home Valuation Report for This Property
The Home Valuation Report is an in-depth analysis detailing your home's value as well as a comparison with similar homes in the area
Home Values in the Area
Average Home Value in this Area
Purchase History
| Date | Buyer | Sale Price | Title Company |
|---|---|---|---|
| Culler Willis C | -- | None Available | |
| Culler Willis C | $262,200 | None Available | |
| Watson Raymond J | $37,500 | -- |
Source: Public Records
Mortgage History
| Date | Status | Borrower | Loan Amount |
|---|---|---|---|
| Open | Culler Willis C | $235,980 | |
| Previous Owner | Watson Raymond J | $206,500 |
Source: Public Records
Tax History
| Year | Tax Paid | Tax Assessment Tax Assessment Total Assessment is a certain percentage of the fair market value that is determined by local assessors to be the total taxable value of land and additions on the property. | Land | Improvement |
|---|---|---|---|---|
| 2024 | $1,779 | $10,799 | $1,600 | $9,199 |
| 2023 | $1,652 | $10,799 | $1,600 | $9,199 |
| 2022 | $1,667 | $10,799 | $1,600 | $9,199 |
| 2020 | $1,746 | $10,799 | $1,600 | $9,199 |
| 2019 | $1,620 | $9,854 | $1,440 | $8,414 |
| 2018 | $1,426 | $9,854 | $1,440 | $8,414 |
| 2017 | $1,389 | $9,854 | $1,440 | $8,414 |
| 2016 | $1,424 | $9,853 | $1,440 | $8,413 |
| 2015 | $1,481 | $9,853 | $1,440 | $8,413 |
| 2014 | $1,481 | $10,276 | $1,528 | $8,748 |
| 2013 | -- | $10,280 | $1,530 | $8,750 |
Source: Public Records
Map
Nearby Homes
- 435 Whits End
- 940 Willow Cove Rd
- 343 Rising Stream Way
- 345 Rising Stream Way
- 533 Mitscher Way
- 407 Rising Stream Way
- 337 Rising Stream Way
- 414 Rising Stream Way
- 415 Rising Stream Way
- 516 Mitscher Way
- 419 Rising Stream Way
- 403 Rising Stream Way
- 314 Rising Stream Way
- 427 Rising Stream Way
- 306 Rising Stream Way
- 302 Rising Stream Way
- 454 Brookridge Dr
- 734 Autumn Shiloh Dr
- 603 Riverdale Ct
- 932 Trident Maple Ln
- 336 Old Forge Rd
- 406 Old Forge Rd
- 227 Hilton View Ct
- 0 Haywain Dr
- 223 Hilton View Ct
- 330 Old Forge Rd
- 412 Old Forge Rd
- 401 Old Forge Rd
- 235 Hilton View Ct
- 219 Hilton View Ct
- 324 Old Forge Rd
- 0 Hilton View Ct Unit 346600
- 0 Hilton View Ct Unit 464268
- 0 Hilton View Ct Unit 463684
- 0 Hilton View Ct Unit 461736
- 0 Hilton View Ct Unit 458191
- 418 Old Forge Rd
- 239 Hilton View Ct
- 111 Haywain Dr
- 220 Hilton View Ct
Your Personal Tour Guide
Ask me questions while you tour the home.