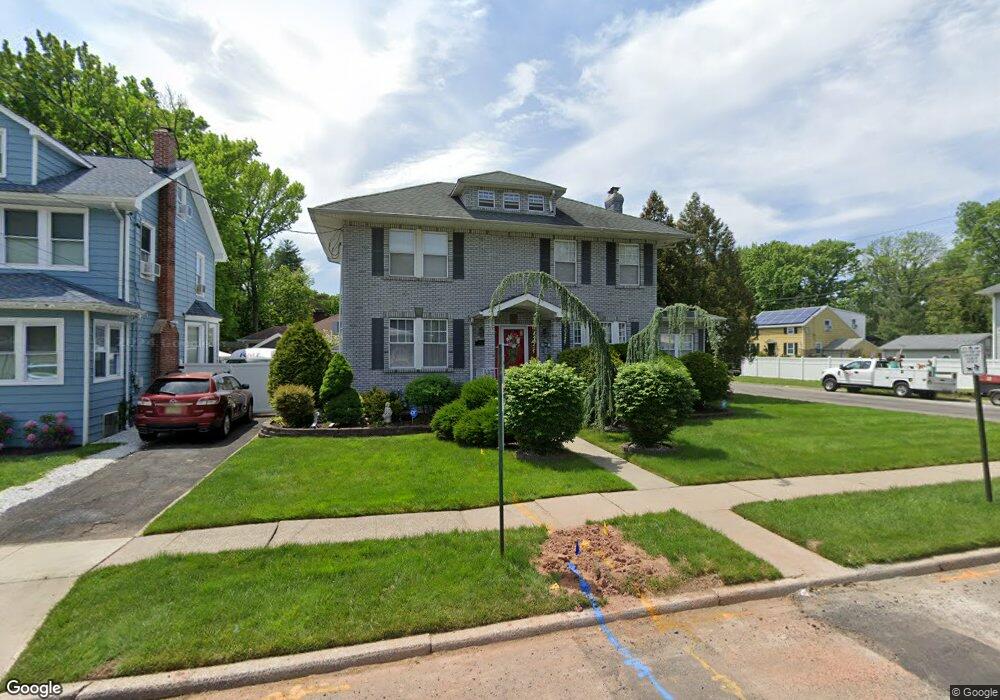
400 Pine St Roselle, NJ 07203
Estimated Value: $529,000 - $580,000
Studio
--
Bath
1,847
Sq Ft
$303/Sq Ft
Est. Value
About This Home
This home is located at 400 Pine St, Roselle, NJ 07203 and is currently estimated at $560,538, approximately $303 per square foot. 400 Pine St is a home located in Union County with nearby schools including Washington Elementary School, Leonard V. Moore Middle School, and Grace Wilday Junior High School.
Ownership History
Date
Name
Owned For
Owner Type
Purchase Details
Closed on
Aug 17, 2004
Sold by
Dunn Ralph
Bought by
Simmons Charles
Current Estimated Value
Home Financials for this Owner
Home Financials are based on the most recent Mortgage that was taken out on this home.
Original Mortgage
$245,000
Outstanding Balance
$121,654
Interest Rate
6.02%
Estimated Equity
$438,884
Create a Home Valuation Report for This Property
The Home Valuation Report is an in-depth analysis detailing your home's value as well as a comparison with similar homes in the area
Home Values in the Area
Average Home Value in this Area
Purchase History
| Date | Buyer | Sale Price | Title Company |
|---|---|---|---|
| Simmons Charles | $285,000 | -- |
Source: Public Records
Mortgage History
| Date | Status | Borrower | Loan Amount |
|---|---|---|---|
| Open | Simmons Charles | $245,000 |
Source: Public Records
Tax History
| Year | Tax Paid | Tax Assessment Tax Assessment Total Assessment is a certain percentage of the fair market value that is determined by local assessors to be the total taxable value of land and additions on the property. | Land | Improvement |
|---|---|---|---|---|
| 2025 | $13,973 | $160,700 | $62,800 | $97,900 |
| 2024 | $13,623 | $160,700 | $62,800 | $97,900 |
| 2023 | $13,623 | $160,700 | $62,800 | $97,900 |
| 2022 | $13,717 | $160,700 | $62,800 | $97,900 |
| 2021 | $13,635 | $160,700 | $62,800 | $97,900 |
| 2020 | $13,592 | $160,700 | $62,800 | $97,900 |
| 2019 | $13,418 | $160,700 | $62,800 | $97,900 |
| 2018 | $13,345 | $160,700 | $62,800 | $97,900 |
| 2017 | $13,274 | $160,700 | $62,800 | $97,900 |
| 2016 | $9,597 | $118,800 | $62,800 | $56,000 |
| 2015 | $9,595 | $118,800 | $62,800 | $56,000 |
| 2014 | $9,328 | $118,800 | $62,800 | $56,000 |
Source: Public Records
Map
Nearby Homes
- 204 Pine St
- 228 Locust St
- 203 Vine St
- 414 Martin St
- 208 Holly Dr
- 210 W 7th Ave
- 415 Wheatsheaf Rd
- 14 Arthur St
- 132 W 6th Ave
- 126 W 5th Ave
- 133 W 3rd Ave
- 454 W 6th Ave
- 162 W 2nd Ave
- 463 W 6th Ave
- 114 E 5th Ave
- 13 Independence Dr
- 14 Colonial Rd
- 123 E 6th Ave
- 119 Columbus Place Unit 2
- 119 Columbus Place
Your Personal Tour Guide
Ask me questions while you tour the home.