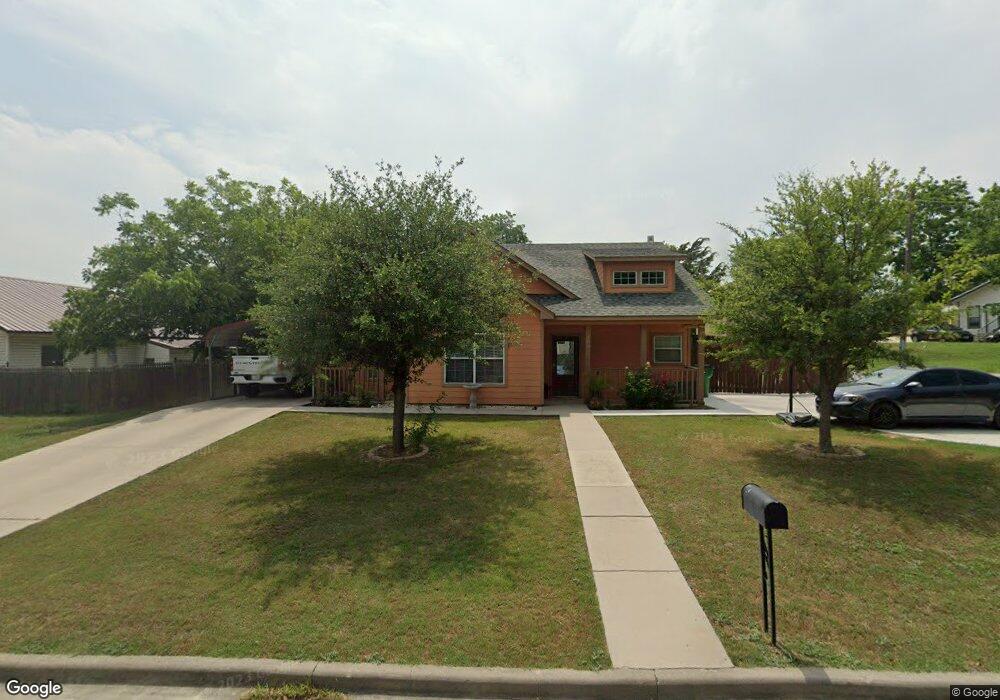
400 S Church St Decatur, TX 76234
Estimated Value: $263,324 - $331,000
--
Bed
--
Bath
1,624
Sq Ft
$188/Sq Ft
Est. Value
About This Home
This home is located at 400 S Church St, Decatur, TX 76234 and is currently estimated at $304,831, approximately $187 per square foot. 400 S Church St is a home with nearby schools including Decatur High School and Victory Christian Academy.
Ownership History
Date
Name
Owned For
Owner Type
Purchase Details
Closed on
Oct 16, 2024
Sold by
Martinez Jose Luis and Martinez Maria Guadalupe
Bought by
Martinez Marcos and Reyes Juana Maria
Current Estimated Value
Purchase Details
Closed on
Dec 7, 2012
Sold by
Cruz Santiago and Cruz Ninfa
Bought by
Martinez Jose Luis
Home Financials for this Owner
Home Financials are based on the most recent Mortgage that was taken out on this home.
Original Mortgage
$97,000
Interest Rate
4.85%
Mortgage Type
Adjustable Rate Mortgage/ARM
Purchase Details
Closed on
May 1, 2009
Sold by
Summers Douglas and Summers Patricia A
Bought by
Cruz Santiago and Cruz Ninfa
Purchase Details
Closed on
Mar 2, 1999
Bought by
Martinez Jose Luis
Purchase Details
Closed on
Jan 31, 1997
Bought by
Martinez Jose Luis
Purchase Details
Closed on
Jun 25, 1996
Bought by
Martinez Jose Luis
Purchase Details
Closed on
Jan 1, 1901
Bought by
Martinez Jose Luis
Create a Home Valuation Report for This Property
The Home Valuation Report is an in-depth analysis detailing your home's value as well as a comparison with similar homes in the area
Home Values in the Area
Average Home Value in this Area
Purchase History
| Date | Buyer | Sale Price | Title Company |
|---|---|---|---|
| Martinez Marcos | -- | None Listed On Document | |
| Martinez Jose Luis | -- | None Available | |
| Cruz Santiago | -- | -- | |
| Martinez Jose Luis | -- | -- | |
| Martinez Jose Luis | -- | -- | |
| Martinez Jose Luis | -- | -- | |
| Martinez Jose Luis | -- | -- |
Source: Public Records
Mortgage History
| Date | Status | Borrower | Loan Amount |
|---|---|---|---|
| Previous Owner | Martinez Jose Luis | $97,000 |
Source: Public Records
Tax History Compared to Growth
Tax History
| Year | Tax Paid | Tax Assessment Tax Assessment Total Assessment is a certain percentage of the fair market value that is determined by local assessors to be the total taxable value of land and additions on the property. | Land | Improvement |
|---|---|---|---|---|
| 2025 | $4,872 | $284,475 | $73,248 | $211,227 |
| 2024 | $4,872 | $267,675 | $54,336 | $213,339 |
| 2023 | $5,033 | $277,455 | $54,336 | $223,119 |
| 2022 | $5,063 | $231,185 | $37,344 | $193,841 |
| 2021 | $4,554 | $199,560 | $37,340 | $162,220 |
| 2020 | $4,341 | $185,060 | $34,940 | $150,120 |
| 2019 | $4,433 | $178,840 | $34,940 | $143,900 |
| 2018 | $4,091 | $158,210 | $14,400 | $143,810 |
| 2017 | $3,755 | $144,660 | $12,000 | $132,660 |
| 2016 | $3,448 | $132,840 | $12,000 | $120,840 |
| 2015 | -- | $132,840 | $12,000 | $120,840 |
| 2014 | -- | $128,710 | $12,000 | $116,710 |
Source: Public Records
Map
Nearby Homes
- 401 S Holman St
- 305 E Shoemaker St
- 709 S Church St
- 204 W Collins St
- 1 S Martin Extension
- 805 Hollyn Dr
- 809 Hollyn Dr
- 813 Hollyn Dr
- 200 W Hale Ave
- 601 W Brady St
- TBD Farm To Market 51
- 506 E Main St
- 604 E Collins St
- 1202 S Hatcher St
- 407 N Lane St
- 502 E Collom St
- 1300 S Trenchard St
- 1300 S Trenchard Street S Decatur Unit TX 76234
- 1304 S State St
- 602 N Cates St
- 404 S Church St
- 304 S Church St
- 403 S Church St
- 403 S Church St Unit B
- 403 S Church St Unit A
- 260 Tres Vista Dr
- 125 Porter Loop
- 151 Denwalt Ln
- 147 Porter Loop
- 162 Chisos Dr
- 220 Nash Ln
- 140 Nash Ln
- 141 Porter Loop
- 2437 N Trinity St
- 139 French Ct
- 126 Crumpler Ln
- 157 Porter Dr
- 133 Porter Loop
- 180 Roark Dr
- 183 Crumpler Ln