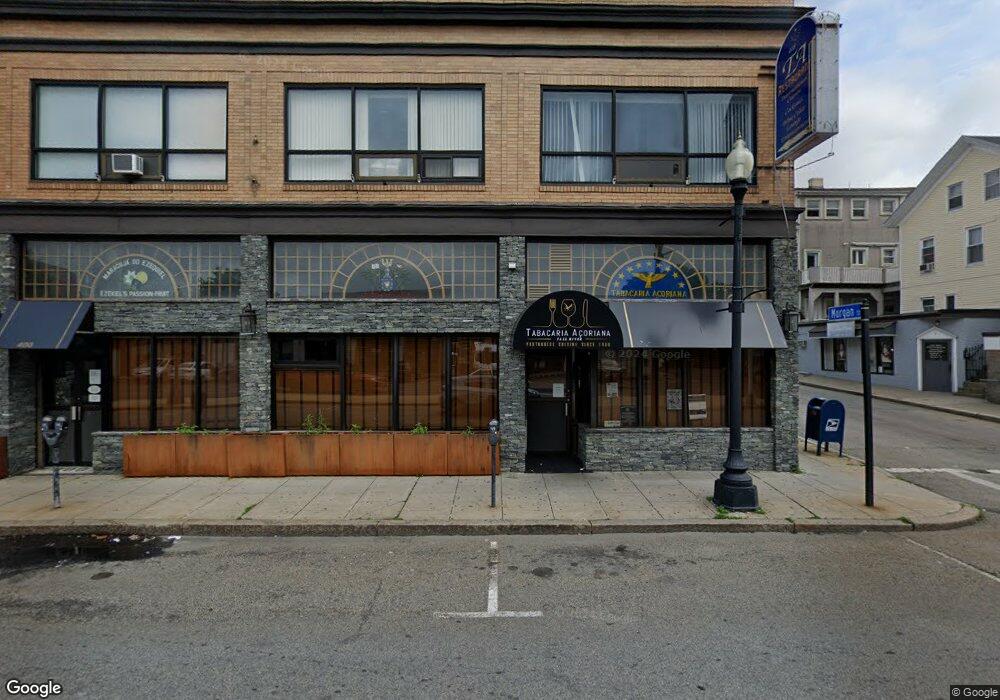
400 S Main St Fall River, MA 02721
Corky Row NeighborhoodEstimated Value: $807,713
Studio
1
Bath
800
Sq Ft
$1,010/Sq Ft
Est. Value
About This Home
This home is located at 400 S Main St, Fall River, MA 02721 and is currently estimated at $807,713, approximately $1,009 per square foot. 400 S Main St is a home located in Bristol County with nearby schools including Henry Lord Community School, B M C Durfee High School, and Argosy Collegiate Charter School.
Ownership History
Date
Name
Owned For
Owner Type
Purchase Details
Closed on
Jan 28, 2016
Sold by
Alves Alfredo P
Bought by
Fks Enterprises Llc
Current Estimated Value
Home Financials for this Owner
Home Financials are based on the most recent Mortgage that was taken out on this home.
Original Mortgage
$400,000
Outstanding Balance
$317,383
Interest Rate
3.97%
Mortgage Type
Commercial
Estimated Equity
$490,330
Purchase Details
Closed on
Mar 15, 1995
Sold by
Furman Maria
Bought by
Alves Alfredo P
Home Financials for this Owner
Home Financials are based on the most recent Mortgage that was taken out on this home.
Original Mortgage
$250,000
Interest Rate
8.89%
Mortgage Type
Commercial
Create a Home Valuation Report for This Property
The Home Valuation Report is an in-depth analysis detailing your home's value as well as a comparison with similar homes in the area
Home Values in the Area
Average Home Value in this Area
Purchase History
| Date | Buyer | Sale Price | Title Company |
|---|---|---|---|
| Fks Enterprises Llc | $400,000 | -- | |
| Alves Alfredo P | $250,000 | -- | |
| Alves Alfredo P | $250,000 | -- |
Source: Public Records
Mortgage History
| Date | Status | Borrower | Loan Amount |
|---|---|---|---|
| Open | Fks Enterprises Llc | $400,000 | |
| Closed | Alves Alfredo P | $400,000 | |
| Previous Owner | Alves Alfredo P | $250,000 |
Source: Public Records
Tax History
| Year | Tax Paid | Tax Assessment Tax Assessment Total Assessment is a certain percentage of the fair market value that is determined by local assessors to be the total taxable value of land and additions on the property. | Land | Improvement |
|---|---|---|---|---|
| 2025 | $16,652 | $698,800 | $152,200 | $546,600 |
| 2024 | $16,557 | $691,600 | $145,000 | $546,600 |
| 2023 | $15,191 | $589,700 | $120,900 | $468,800 |
| 2022 | $15,940 | $589,700 | $120,900 | $468,800 |
| 2021 | $17,502 | $589,300 | $120,900 | $468,400 |
| 2020 | $17,579 | $574,300 | $111,700 | $462,600 |
| 2019 | $18,010 | $574,300 | $111,700 | $462,600 |
| 2018 | $13,721 | $440,900 | $111,700 | $329,200 |
| 2017 | $19,432 | $634,200 | $111,700 | $522,500 |
| 2016 | $18,474 | $634,200 | $111,700 | $522,500 |
| 2015 | $17,863 | $634,800 | $111,700 | $523,100 |
| 2014 | $16,936 | $634,800 | $111,700 | $523,100 |
Source: Public Records
Map
Nearby Homes
- 400 S Main St Unit E
- 400 S Main St Unit F
- 400 S Main St Unit D
- 400 S Main St Unit C
- 400 S Main St Unit A
- 400 S Main St Unit B
- 400 S Main St Unit 2
- 408 S Main St
- 390 S Main St Unit 202
- 390 S Main St Unit suite2
- 390 S Main St Unit storefront
- 390 S Main St Unit 201
- 390 S Main St
- 7 Ridge St Unit 2
- 5 Ridge St
- 5 Ridge St Unit 1
- 418 S Main St
- 420 S Main St Unit 2nd Fl
- 420 S Main St Unit Ground
- 420 S Main St
Your Personal Tour Guide
Ask me questions while you tour the home.