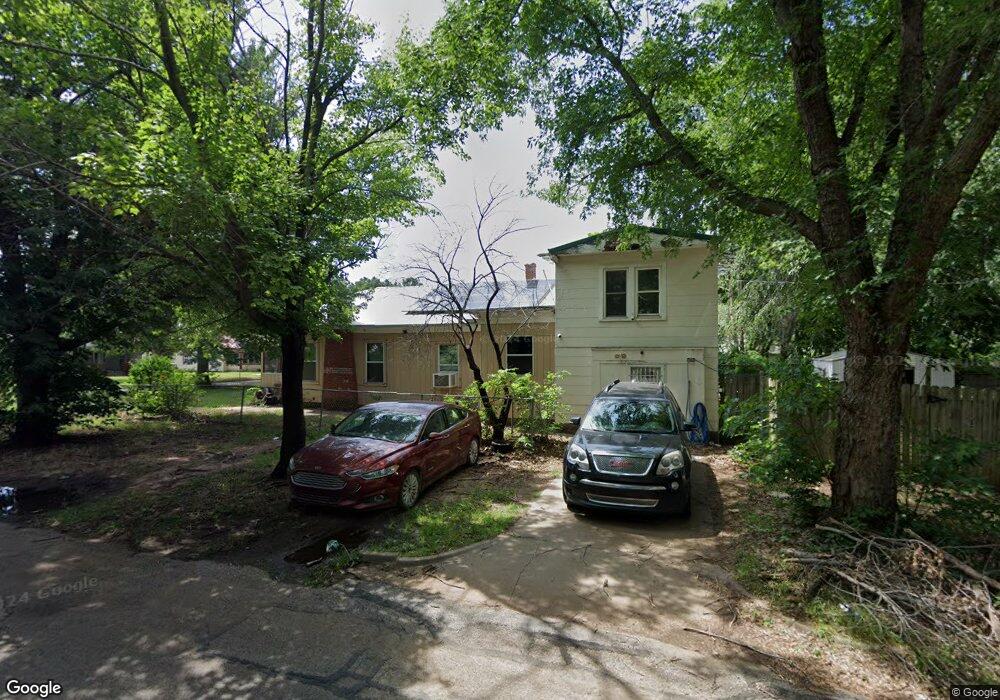
400 S Palm St Ponca City, OK 74601
Estimated Value: $50,000 - $78,000
3
Beds
2
Baths
1,624
Sq Ft
$40/Sq Ft
Est. Value
About This Home
This home is located at 400 S Palm St, Ponca City, OK 74601 and is currently estimated at $64,611, approximately $39 per square foot. 400 S Palm St is a home located in Kay County with nearby schools including Lincoln Elementary School, Ponca City West Middle School, and Ponca City East Middle School.
Ownership History
Date
Name
Owned For
Owner Type
Purchase Details
Closed on
Aug 30, 2016
Sold by
Nicholson Homer L and Rozell Barbara M
Bought by
Cockrum Timothy
Current Estimated Value
Purchase Details
Closed on
Apr 26, 2013
Sold by
Midgley Maurice E and Midgley Anita J
Bought by
Nicholson Homer L and Rozell Barbara M
Home Financials for this Owner
Home Financials are based on the most recent Mortgage that was taken out on this home.
Original Mortgage
$32,000
Interest Rate
3.61%
Mortgage Type
Purchase Money Mortgage
Purchase Details
Closed on
Aug 2, 2011
Sold by
Whitener Coy L and Whitener Lyda L
Bought by
Midgley Maurice E
Create a Home Valuation Report for This Property
The Home Valuation Report is an in-depth analysis detailing your home's value as well as a comparison with similar homes in the area
Home Values in the Area
Average Home Value in this Area
Purchase History
| Date | Buyer | Sale Price | Title Company |
|---|---|---|---|
| Cockrum Timothy | $37,000 | None Available | |
| Nicholson Homer L | $32,000 | None Available | |
| Midgley Maurice E | $30,000 | -- |
Source: Public Records
Mortgage History
| Date | Status | Borrower | Loan Amount |
|---|---|---|---|
| Previous Owner | Nicholson Homer L | $32,000 |
Source: Public Records
Tax History Compared to Growth
Tax History
| Year | Tax Paid | Tax Assessment Tax Assessment Total Assessment is a certain percentage of the fair market value that is determined by local assessors to be the total taxable value of land and additions on the property. | Land | Improvement |
|---|---|---|---|---|
| 2024 | $360 | $3,807 | $447 | $3,360 |
| 2023 | $360 | $3,626 | $447 | $3,179 |
| 2022 | $329 | $3,453 | $447 | $3,006 |
| 2021 | $330 | $3,453 | $447 | $3,006 |
| 2020 | $327 | $3,452 | $447 | $3,005 |
| 2019 | $314 | $3,287 | $447 | $2,840 |
| 2018 | $337 | $3,484 | $339 | $3,145 |
| 2017 | $341 | $3,484 | $339 | $3,145 |
| 2016 | $345 | $3,484 | $339 | $3,145 |
| 2015 | $348 | $3,496 | $339 | $3,157 |
| 2014 | $344 | $3,520 | $339 | $3,181 |
Source: Public Records
Map
Nearby Homes