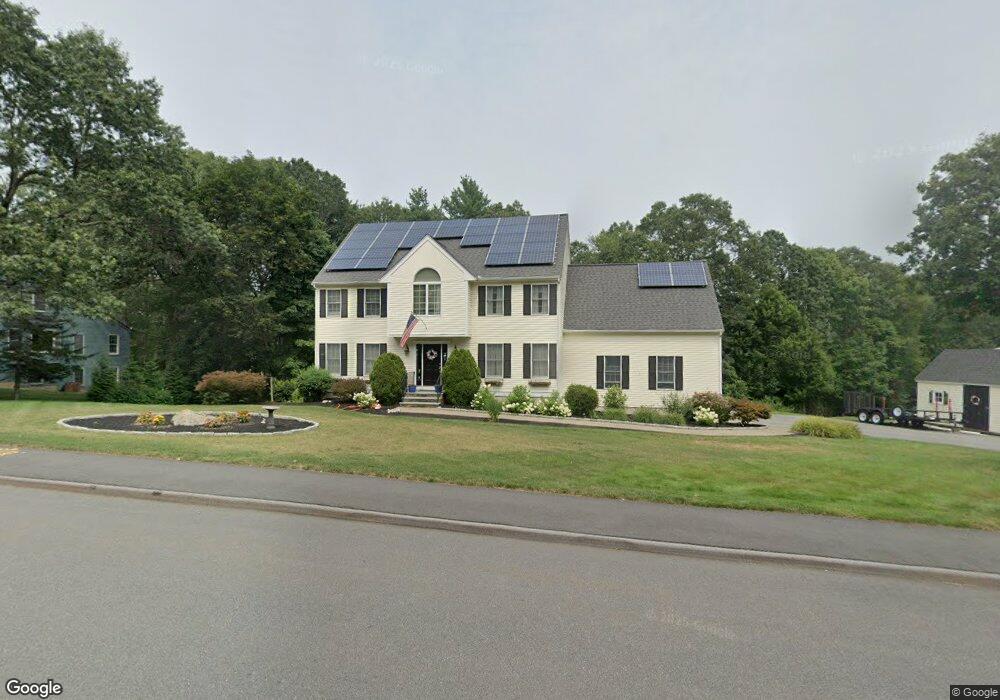
400 Simpson Rd Marlborough, MA 01752
Estimated Value: $916,220 - $1,002,000
4
Beds
3
Baths
3,301
Sq Ft
$294/Sq Ft
Est. Value
About This Home
This home is located at 400 Simpson Rd, Marlborough, MA 01752 and is currently estimated at $969,805, approximately $293 per square foot. 400 Simpson Rd is a home located in Middlesex County with nearby schools including Marlborough High School, New Covenant Christian School, and Glenhaven Academy - JRI School.
Ownership History
Date
Name
Owned For
Owner Type
Purchase Details
Closed on
Dec 29, 1989
Sold by
Kendall Homes Inc
Bought by
Kaloustian Anthony W
Current Estimated Value
Purchase Details
Closed on
Aug 24, 1989
Sold by
Mellon Devel Co Inc
Bought by
Kendall Homes Inc
Create a Home Valuation Report for This Property
The Home Valuation Report is an in-depth analysis detailing your home's value as well as a comparison with similar homes in the area
Home Values in the Area
Average Home Value in this Area
Purchase History
| Date | Buyer | Sale Price | Title Company |
|---|---|---|---|
| Kaloustian Anthony W | $307,000 | -- | |
| Kendall Homes Inc | $105,000 | -- |
Source: Public Records
Mortgage History
| Date | Status | Borrower | Loan Amount |
|---|---|---|---|
| Open | Kendall Homes Inc | $169,100 | |
| Closed | Kendall Homes Inc | $185,000 | |
| Closed | Kendall Homes Inc | $175,000 |
Source: Public Records
Tax History Compared to Growth
Tax History
| Year | Tax Paid | Tax Assessment Tax Assessment Total Assessment is a certain percentage of the fair market value that is determined by local assessors to be the total taxable value of land and additions on the property. | Land | Improvement |
|---|---|---|---|---|
| 2025 | $8,513 | $863,400 | $231,800 | $631,600 |
| 2024 | $8,325 | $813,000 | $210,800 | $602,200 |
| 2023 | $8,279 | $717,400 | $182,300 | $535,100 |
| 2022 | $7,982 | $608,400 | $173,600 | $434,800 |
| 2021 | $16,825 | $577,800 | $144,700 | $433,100 |
| 2020 | $12,112 | $551,800 | $136,800 | $415,000 |
| 2019 | $7,570 | $538,000 | $135,100 | $402,900 |
| 2018 | $5,094 | $518,300 | $118,700 | $399,600 |
| 2017 | $7,842 | $511,900 | $118,900 | $393,000 |
| 2016 | $7,569 | $493,400 | $118,900 | $374,500 |
| 2015 | $7,291 | $462,600 | $122,300 | $340,300 |
Source: Public Records
Map
Nearby Homes