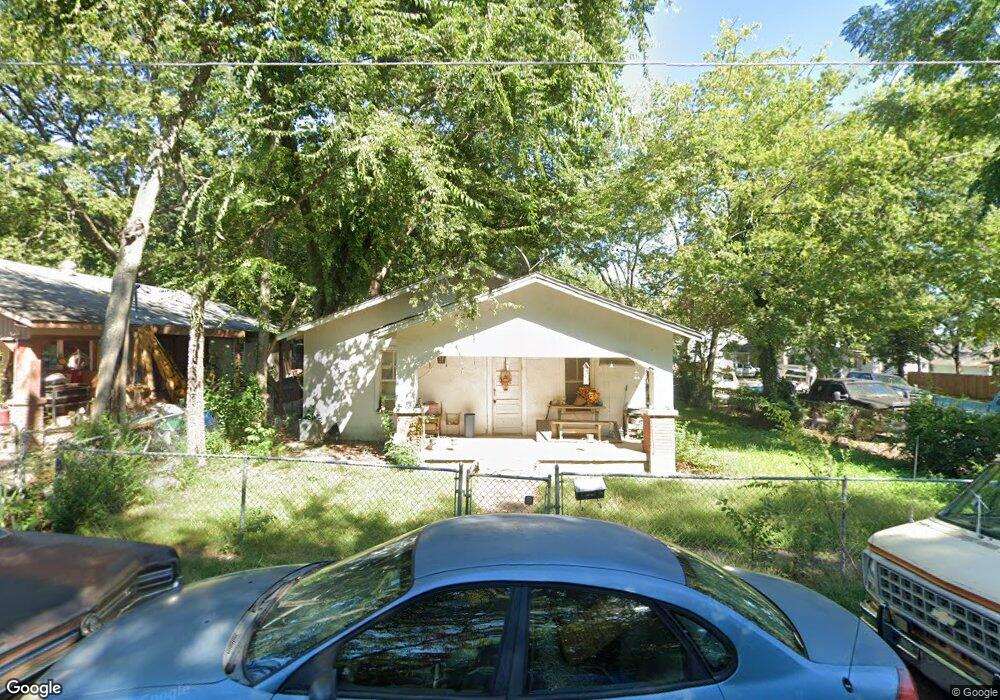
400 Thornton St Hot Springs National Park, AR 71913
Estimated Value: $64,607 - $92,000
--
Bed
1
Bath
862
Sq Ft
$93/Sq Ft
Est. Value
About This Home
This home is located at 400 Thornton St, Hot Springs National Park, AR 71913 and is currently estimated at $80,152, approximately $92 per square foot. 400 Thornton St is a home located in Garland County with nearby schools including Hot Springs Middle School, Hot Springs World Class High School, and Gospel Light Christian School.
Ownership History
Date
Name
Owned For
Owner Type
Purchase Details
Closed on
Sep 20, 2016
Sold by
Smith Naomi A and Arguello Joyce W
Bought by
Phillips Janet L
Current Estimated Value
Home Financials for this Owner
Home Financials are based on the most recent Mortgage that was taken out on this home.
Original Mortgage
$15,120
Outstanding Balance
$13,263
Interest Rate
7%
Mortgage Type
Purchase Money Mortgage
Estimated Equity
$66,889
Purchase Details
Closed on
Aug 4, 2016
Sold by
Troyer Mavis J and Troyer Irvin N
Bought by
Smith Naomi A and Arguello Joyce W
Home Financials for this Owner
Home Financials are based on the most recent Mortgage that was taken out on this home.
Original Mortgage
$15,120
Outstanding Balance
$13,263
Interest Rate
7%
Mortgage Type
Purchase Money Mortgage
Estimated Equity
$66,889
Purchase Details
Closed on
Jan 1, 1997
Sold by
Not Provided
Bought by
Smith Naomi A and Arguello Joyce
Purchase Details
Closed on
Jan 1, 1901
Bought by
Smith Dwight H
Create a Home Valuation Report for This Property
The Home Valuation Report is an in-depth analysis detailing your home's value as well as a comparison with similar homes in the area
Home Values in the Area
Average Home Value in this Area
Purchase History
| Date | Buyer | Sale Price | Title Company |
|---|---|---|---|
| Phillips Janet L | $15,120 | Hot Springs Title Company | |
| Smith Naomi A | $3,500 | None Available | |
| Smith Naomi A | -- | -- | |
| Smith Dwight H | -- | -- |
Source: Public Records
Mortgage History
| Date | Status | Borrower | Loan Amount |
|---|---|---|---|
| Open | Phillips Janet L | $15,120 |
Source: Public Records
Tax History Compared to Growth
Tax History
| Year | Tax Paid | Tax Assessment Tax Assessment Total Assessment is a certain percentage of the fair market value that is determined by local assessors to be the total taxable value of land and additions on the property. | Land | Improvement |
|---|---|---|---|---|
| 2025 | $216 | $6,710 | $1,190 | $5,520 |
| 2024 | -- | $6,710 | $1,190 | $5,520 |
| 2023 | $0 | $6,710 | $1,190 | $5,520 |
| 2022 | $179 | $6,710 | $1,190 | $5,520 |
| 2021 | $172 | $3,770 | $700 | $3,070 |
| 2020 | $188 | $3,770 | $700 | $3,070 |
| 2019 | $188 | $3,770 | $700 | $3,070 |
| 2018 | $0 | $3,770 | $700 | $3,070 |
| 2017 | $0 | $3,770 | $700 | $3,070 |
| 2016 | $188 | $4,550 | $840 | $3,710 |
| 2015 | $188 | $4,550 | $840 | $3,710 |
| 2014 | $187 | $4,550 | $840 | $3,710 |
Source: Public Records
Map
Nearby Homes
- 1102 Rector St
- 212 Jeffries St
- 400 Summer St
- 210 Jeffries St
- 209 N Patterson St
- 907 Garland Ave
- 1020 Prospect Ave
- 1113 W Grand Ave
- 144 Centerview St
- 705 Ward St
- 1648 Hobson Ave
- 407 7th St
- 206 Noxon St
- 202 Fawn St
- 1010 Greenwood Ave Unit & 101 Peculiar Alley
- 400 6th St
- 911 Prospect Ave
- 1003 W Grand Ave Unit A & B
- 406 Thornton St
- 0 Thornton St
- 1104 Rector St
- 410 Thornton St
- 318 Thornton St
- 316 Thornton St
- 414 Thornton St
- 401 Thornton St
- 1103 Rector St
- 409 Thornton St
- 321 Thornton St
- 409 Beard St
- 409 Beard St Unit See comments
- 418 Thornton St
- 401 Beard St
- 418 Thornton St
- 407 Beard St
- 310 Thornton St
- 417 Thornton St
- 0 Beard