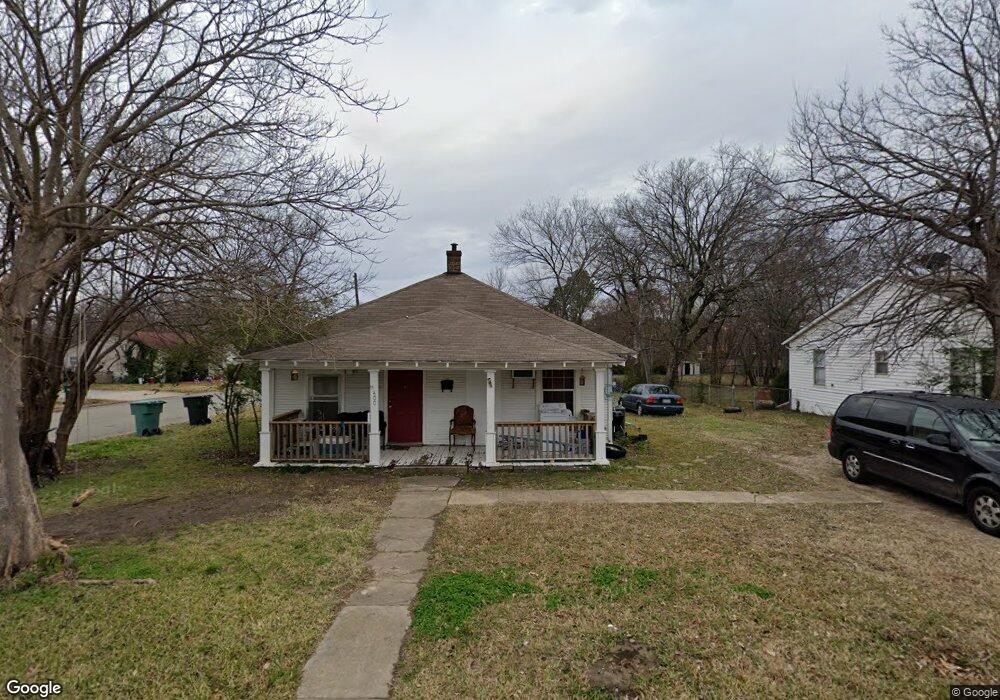
400 W Fairview St Sherman, TX 75092
Estimated Value: $186,673 - $224,000
--
Bed
--
Bath
1,204
Sq Ft
$171/Sq Ft
Est. Value
About This Home
This home is located at 400 W Fairview St, Sherman, TX 75092 and is currently estimated at $205,337, approximately $170 per square foot. 400 W Fairview St is a home located in Grayson County with nearby schools including Fairview Elementary School, Piner Middle School, and Dillingham Intermediate School.
Ownership History
Date
Name
Owned For
Owner Type
Purchase Details
Closed on
Jun 2, 2015
Sold by
Sammons Shelly Rene
Bought by
Texoma S & D Properties Inc and S & D Properties
Current Estimated Value
Purchase Details
Closed on
Jul 15, 2010
Sold by
S & D Properties
Bought by
Sammons Shelly Rene
Home Financials for this Owner
Home Financials are based on the most recent Mortgage that was taken out on this home.
Original Mortgage
$34,500
Interest Rate
4.51%
Mortgage Type
Seller Take Back
Purchase Details
Closed on
Nov 6, 2009
Sold by
Tehuintle Manuel
Bought by
Himmelreich Dale and S&D Properties
Purchase Details
Closed on
Aug 15, 2007
Sold by
Himmelreich Dale
Bought by
Tehuintle Manuel
Purchase Details
Closed on
Jul 16, 2007
Sold by
Anderson Claude L
Bought by
Himmelreich Dale and S & D Properties
Create a Home Valuation Report for This Property
The Home Valuation Report is an in-depth analysis detailing your home's value as well as a comparison with similar homes in the area
Home Values in the Area
Average Home Value in this Area
Purchase History
| Date | Buyer | Sale Price | Title Company |
|---|---|---|---|
| Texoma S & D Properties Inc | $27,000 | None Available | |
| Sammons Shelly Rene | -- | None Available | |
| Himmelreich Dale | $31,500 | None Available | |
| Tehuintle Manuel | -- | None Available | |
| Himmelreich Dale | -- | Chapin Title Co Inc |
Source: Public Records
Mortgage History
| Date | Status | Borrower | Loan Amount |
|---|---|---|---|
| Previous Owner | Sammons Shelly Rene | $34,500 | |
| Closed | Tehuintle Manuel | $0 |
Source: Public Records
Tax History Compared to Growth
Tax History
| Year | Tax Paid | Tax Assessment Tax Assessment Total Assessment is a certain percentage of the fair market value that is determined by local assessors to be the total taxable value of land and additions on the property. | Land | Improvement |
|---|---|---|---|---|
| 2025 | $4,090 | $183,083 | $67,047 | $116,036 |
| 2024 | $4,090 | $186,481 | $67,047 | $119,434 |
| 2023 | $3,884 | $176,922 | $47,952 | $128,970 |
| 2022 | $2,259 | $96,383 | $46,509 | $49,874 |
| 2021 | $2,148 | $85,698 | $44,048 | $41,650 |
| 2020 | $1,786 | $68,036 | $22,915 | $45,121 |
| 2019 | $1,176 | $43,641 | $10,184 | $33,457 |
| 2018 | $1,007 | $40,142 | $8,063 | $32,079 |
| 2017 | $1,030 | $41,389 | $8,063 | $33,326 |
| 2016 | $1,027 | $41,264 | $8,063 | $33,201 |
| 2015 | $412 | $32,370 | $8,063 | $24,307 |
| 2014 | $556 | $32,370 | $8,063 | $24,307 |
Source: Public Records
Map
Nearby Homes
- 1718 N Shannon St
- 1611 N Alexander St
- 415 W Taylor St
- 225 W Texas St
- 426 W McGee St
- 224 W Dexter St
- 1711 N Ricketts St
- 210 W Dexter St
- 311 W Scott St
- 409 W Burton St
- 2106 N Alexander St
- 2117 N Shannon St
- 2121 N Alexander St
- 425 W Belden St
- 1709 N Binkley St
- 2221 N Alexander St
- 1824 N Binkley St
- 1402 N Ricketts St
- 2312 N Shannon St
- 1825 N Highland Ave
- 406 W Fairview St
- 1802 N Alexander St
- 324 W Fairview St
- 1718 N Alexander St
- 410 W Fairview St
- 1806 N Alexander St
- 1803 N Alexander St
- 1715 N Alexander St
- 318 W Fairview St
- 1810 N Alexander St
- 411 W Fairview St
- 1711 N Alexander St
- 419 W Fairview St
- 1811 N Alexander St
- 403 W Texas St
- 319 W Fairview St
- 312 W Fairview St
- 1818 N Alexander St
- 327 W Texas St
- 327 W Texas St Unit ID1309041P