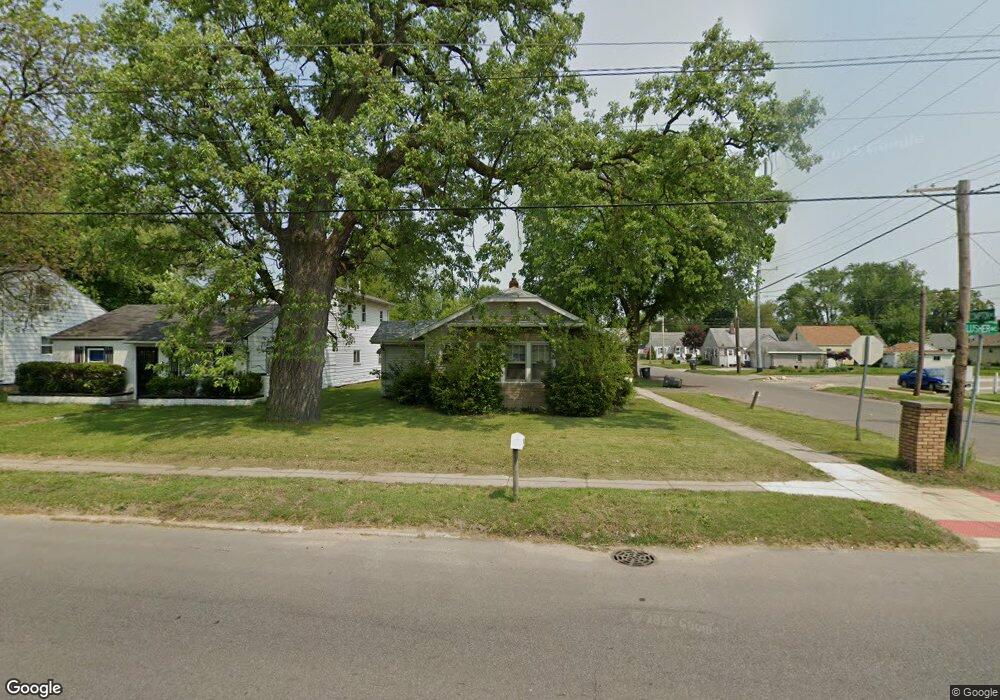
400 W Lusher Ave Elkhart, IN 46517
Impact NeighborhoodEstimated Value: $85,000 - $114,000
2
Beds
1
Bath
1,184
Sq Ft
$89/Sq Ft
Est. Value
About This Home
This home is located at 400 W Lusher Ave, Elkhart, IN 46517 and is currently estimated at $105,953, approximately $89 per square foot. 400 W Lusher Ave is a home located in Elkhart County with nearby schools including Hawthorne Elementary School, Roosevelt STEAM Academy, and Pierre Moran Middle School.
Ownership History
Date
Name
Owned For
Owner Type
Purchase Details
Closed on
Jan 9, 2023
Sold by
Simons Jeff
Bought by
Simons Jeff and Simons Barbara
Current Estimated Value
Purchase Details
Closed on
Feb 8, 2021
Sold by
Nrothern Investments Llc
Bought by
Simons Jeff
Purchase Details
Closed on
Nov 5, 2020
Sold by
Cobb Development Llc
Bought by
Northern Investments Llc
Purchase Details
Closed on
May 21, 2008
Sold by
Keybank Na
Bought by
Cobb Development Llc
Purchase Details
Closed on
Mar 26, 2008
Sold by
Valencia Veronica
Bought by
Keybank Na
Purchase Details
Closed on
Sep 19, 2006
Sold by
Tinoco Alejandro
Bought by
Valencia Veronica
Home Financials for this Owner
Home Financials are based on the most recent Mortgage that was taken out on this home.
Original Mortgage
$82,440
Interest Rate
6.59%
Mortgage Type
Purchase Money Mortgage
Create a Home Valuation Report for This Property
The Home Valuation Report is an in-depth analysis detailing your home's value as well as a comparison with similar homes in the area
Home Values in the Area
Average Home Value in this Area
Purchase History
| Date | Buyer | Sale Price | Title Company |
|---|---|---|---|
| Simons Jeff | -- | Fidelity National Title | |
| Simons Jeff | -- | Fidelity National Title | |
| Northern Investments Llc | -- | Fidelity National Title | |
| Cobb Development Llc | -- | Statewide Title Company Inc | |
| Keybank Na | $66,600 | None Available | |
| Valencia Veronica | -- | Metropolitan Title |
Source: Public Records
Mortgage History
| Date | Status | Borrower | Loan Amount |
|---|---|---|---|
| Previous Owner | Valencia Veronica | $82,440 |
Source: Public Records
Tax History Compared to Growth
Tax History
| Year | Tax Paid | Tax Assessment Tax Assessment Total Assessment is a certain percentage of the fair market value that is determined by local assessors to be the total taxable value of land and additions on the property. | Land | Improvement |
|---|---|---|---|---|
| 2024 | $1,015 | $51,800 | $8,300 | $43,500 |
| 2022 | $1,015 | $32,100 | $8,300 | $23,800 |
| 2021 | $673 | $32,100 | $8,300 | $23,800 |
| 2020 | $888 | $40,100 | $8,300 | $31,800 |
| 2019 | $817 | $37,000 | $8,300 | $28,700 |
| 2018 | $640 | $28,600 | $4,100 | $24,500 |
| 2017 | $642 | $28,600 | $4,100 | $24,500 |
| 2016 | $640 | $28,600 | $4,100 | $24,500 |
| 2014 | $577 | $26,800 | $4,100 | $22,700 |
| 2013 | $566 | $28,000 | $12,900 | $15,100 |
Source: Public Records
Map
Nearby Homes
- 409 W Wolf Ave
- 714 W Blaine Ave
- 421 W Garfield Ave
- Lot 34 Auburn Estates
- 2301 Aurora Ave
- VL El Paco Manor
- Lot 13 Parkway Ave
- Lot 12 Parkway Ave
- 7A Parkway Ave
- Lot 10 Parkway Ave
- Lot 8 Parkway Ave
- Lot 11 Parkway Ave
- Lot 17 Parkway Ave
- 2009 Roys Ave
- 919 W Wolf Ave
- 1524 Frances Ave
- 1011 Benham Ct
- 1308 Eden St
- 57782 9th St
- 710 E Indiana Ave
- 406 W Lusher Ave
- 410 W Lusher Ave
- 2039 Compton Ave
- 409 Concord Ave
- 418 W Lusher Ave
- 2035 Compton Ave
- 351 Concord Ave
- 342 W Lusher Ave
- 413 Concord Ave
- 347 Concord Ave
- 500 W Lusher Ave
- 417 Concord Ave
- 336 W Lusher Ave
- 506 W Lusher Ave
- 505 Concord Ave
- 337 Concord Ave
- 332 W Lusher Ave
- 508 W Lusher Ave
- 333 Concord Ave
- 400 Concord Ave