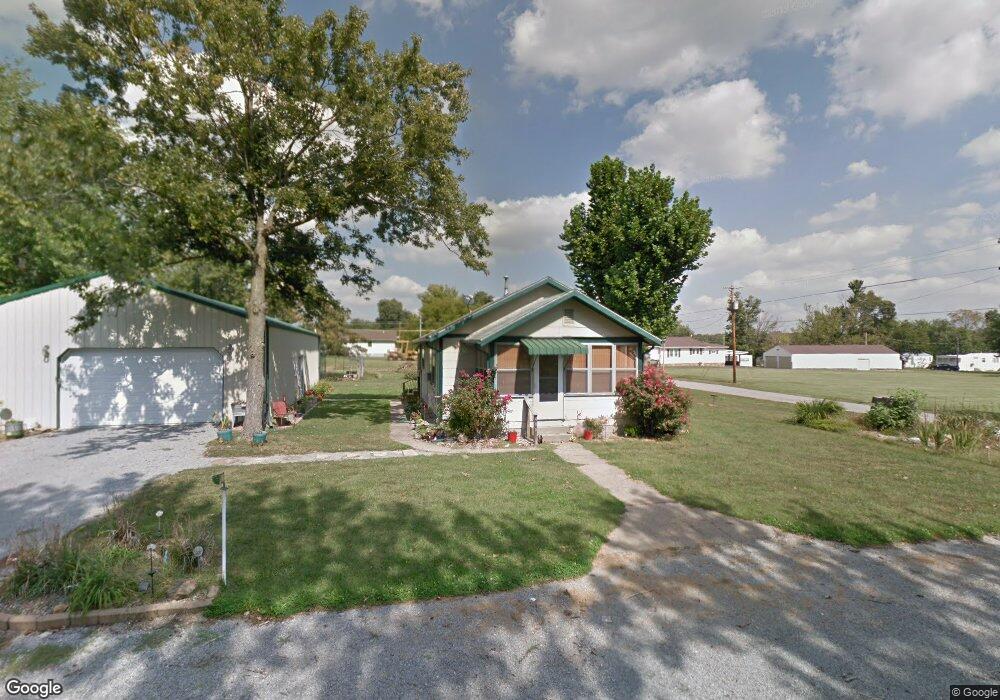
400 W Warwick Ave Mc Leansboro, IL 62859
McLeansboro NeighborhoodEstimated Value: $60,000 - $82,000
--
Bed
--
Bath
--
Sq Ft
0.33
Acres
About This Home
This home is located at 400 W Warwick Ave, Mc Leansboro, IL 62859 and is currently estimated at $67,080. 400 W Warwick Ave is a home with nearby schools including Hamilton County Junior/Senior High School.
Ownership History
Date
Name
Owned For
Owner Type
Purchase Details
Closed on
Jan 16, 2022
Sold by
Ty Guthrie
Bought by
Kinnear Cody
Current Estimated Value
Purchase Details
Closed on
Oct 27, 2017
Sold by
Hopfinger Melissa R and Hopfinger John D
Bought by
Guthrie Ty
Home Financials for this Owner
Home Financials are based on the most recent Mortgage that was taken out on this home.
Original Mortgage
$51,515
Interest Rate
3.83%
Mortgage Type
New Conventional
Purchase Details
Closed on
Apr 22, 2014
Sold by
Karcher Bryan A and Karcher Melissa R
Bought by
Hopfinger Melissa R and Hopfinger John Dale
Purchase Details
Closed on
Apr 15, 2011
Sold by
Braden Nathan K
Bought by
Karcher Bryan A and Karcher Melissa R
Home Financials for this Owner
Home Financials are based on the most recent Mortgage that was taken out on this home.
Original Mortgage
$40,000
Interest Rate
4.77%
Mortgage Type
New Conventional
Purchase Details
Closed on
Jul 31, 2010
Sold by
Braden Summer C
Bought by
Braden Nathan K
Purchase Details
Closed on
Aug 4, 2005
Sold by
Blackford Michael D and Blackford Amber D
Bought by
Braden Nathan K and Braden Summer C
Create a Home Valuation Report for This Property
The Home Valuation Report is an in-depth analysis detailing your home's value as well as a comparison with similar homes in the area
Home Values in the Area
Average Home Value in this Area
Purchase History
| Date | Buyer | Sale Price | Title Company |
|---|---|---|---|
| Kinnear Cody | $48,000 | Van Winkle & Van Winkle | |
| Guthrie Ty | $50,000 | -- | |
| Hopfinger Melissa R | -- | None Available | |
| Karcher Bryan A | $50,000 | None Available | |
| Braden Nathan K | -- | None Available | |
| Braden Nathan K | $26,500 | None Available |
Source: Public Records
Mortgage History
| Date | Status | Borrower | Loan Amount |
|---|---|---|---|
| Previous Owner | Guthrie Ty | $51,515 | |
| Previous Owner | Karcher Bryan A | $40,000 |
Source: Public Records
Tax History Compared to Growth
Tax History
| Year | Tax Paid | Tax Assessment Tax Assessment Total Assessment is a certain percentage of the fair market value that is determined by local assessors to be the total taxable value of land and additions on the property. | Land | Improvement |
|---|---|---|---|---|
| 2024 | $1,389 | $16,431 | $3,090 | $13,341 |
| 2023 | $1,389 | $16,940 | $3,186 | $13,754 |
| 2022 | $510 | $11,929 | $2,986 | $8,943 |
| 2021 | $510 | $11,471 | $2,871 | $8,600 |
| 2020 | $459 | $10,800 | $2,703 | $8,097 |
| 2019 | $459 | $10,800 | $2,703 | $8,097 |
| 2018 | $463 | $4,800 | $2,703 | $2,097 |
| 2017 | $461 | $4,800 | $2,703 | $2,097 |
| 2015 | $460 | $4,869 | $2,720 | $2,149 |
| 2014 | $447 | $10,485 | $2,624 | $7,861 |
| 2013 | -- | $10,485 | $2,624 | $7,861 |
| 2012 | -- | $8,962 | $2,243 | $6,719 |
Source: Public Records
Map
Nearby Homes
- 000 E Maple St
- 210 N Virginia St
- 201 N Washington St
- 16128 Cr 1030 N
- 708 E Foote St
- 312 E Randolph St
- 54 Meadow Hills Ln
- 000 Memory Ln
- 000 Eric Ln
- 1010 E Randolph St
- 4693 Illinois 14
- 000 County Road 1000
- 0 County Road 1000 N Unit Lot WP001
- 12324 Rd
- 0 County Road 900 N
- 0 County Road 750 N Unit RMAEB457700
- 0000 Campbell's Corner Rd
- 000 Jacob St
- 602 S 4th St
- 722 W Main St
- 805 N Virginia St
- 710 N Virginia St
- 805 N Harris Place
- 708 N Virginia St
- 708 N Virginia St
- 806 N Harris Place
- 310 W Moore Place
- 708 N Harris Place
- 708 N Harris Place
- 402 Moore St
- 701 N Park St
- 701 N Park St
- 701 N Park St
- 701 N Park St
- 701 N Park St
- 701 N Park St
- 701 N Park St
- 701 N Park St
- 701 N Park St
- 701 N Park St