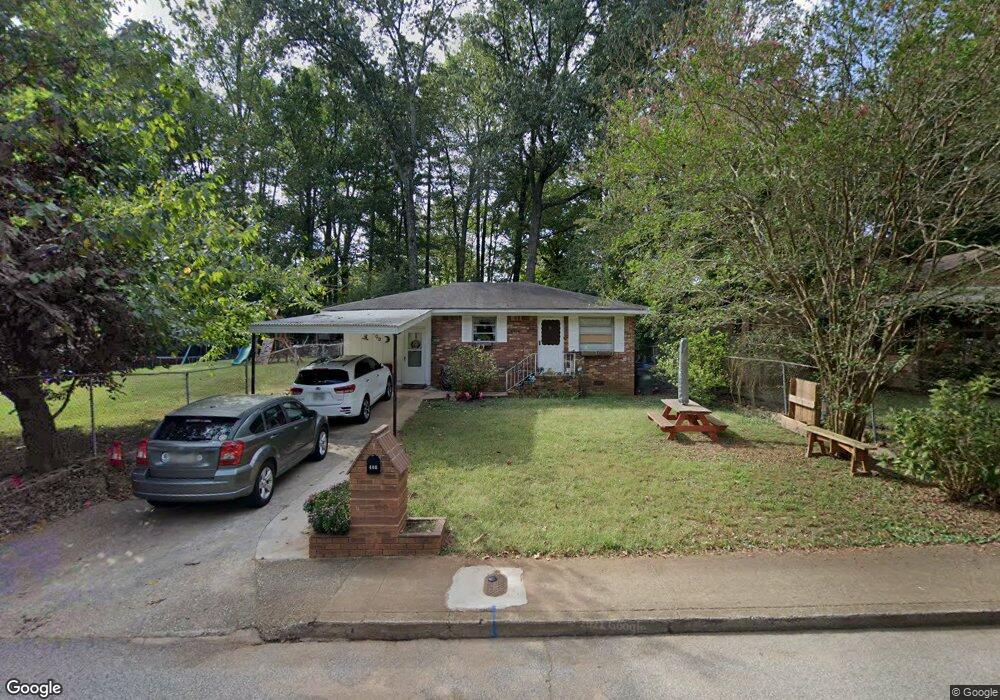
400 Walnut St Atlanta, GA 30354
Estimated Value: $266,708 - $360,000
3
Beds
1
Bath
1,751
Sq Ft
$174/Sq Ft
Est. Value
About This Home
This home is located at 400 Walnut St, Atlanta, GA 30354 and is currently estimated at $303,927, approximately $173 per square foot. 400 Walnut St is a home located in Fulton County with nearby schools including Hapeville Elementary School, Paul D. West Middle School, and Tri-Cities High School.
Ownership History
Date
Name
Owned For
Owner Type
Purchase Details
Closed on
Feb 20, 2006
Sold by
Hulgan Henry E
Bought by
Juarez Martin A
Current Estimated Value
Home Financials for this Owner
Home Financials are based on the most recent Mortgage that was taken out on this home.
Original Mortgage
$88,400
Outstanding Balance
$54,895
Interest Rate
8%
Mortgage Type
New Conventional
Estimated Equity
$249,032
Purchase Details
Closed on
May 18, 1999
Sold by
Smelley Travis L and Smelley Patsy J
Bought by
Hulgan Henry E
Create a Home Valuation Report for This Property
The Home Valuation Report is an in-depth analysis detailing your home's value as well as a comparison with similar homes in the area
Home Values in the Area
Average Home Value in this Area
Purchase History
| Date | Buyer | Sale Price | Title Company |
|---|---|---|---|
| Juarez Martin A | $93,100 | -- | |
| Hulgan Henry E | $65,000 | -- |
Source: Public Records
Mortgage History
| Date | Status | Borrower | Loan Amount |
|---|---|---|---|
| Open | Juarez Martin A | $88,400 |
Source: Public Records
Tax History Compared to Growth
Tax History
| Year | Tax Paid | Tax Assessment Tax Assessment Total Assessment is a certain percentage of the fair market value that is determined by local assessors to be the total taxable value of land and additions on the property. | Land | Improvement |
|---|---|---|---|---|
| 2025 | $1,724 | $102,720 | $22,840 | $79,880 |
| 2023 | $3,202 | $113,440 | $27,920 | $85,520 |
| 2022 | $448 | $95,920 | $35,640 | $60,280 |
| 2021 | $896 | $71,960 | $23,480 | $48,480 |
| 2020 | $1,213 | $63,520 | $19,920 | $43,600 |
| 2019 | $880 | $64,640 | $7,880 | $56,760 |
| 2018 | $1,102 | $63,120 | $7,680 | $55,440 |
| 2017 | $419 | $24,280 | $4,640 | $19,640 |
| 2016 | $418 | $24,280 | $4,640 | $19,640 |
| 2015 | $657 | $24,280 | $4,640 | $19,640 |
| 2014 | $421 | $24,280 | $4,640 | $19,640 |
Source: Public Records
Map
Nearby Homes