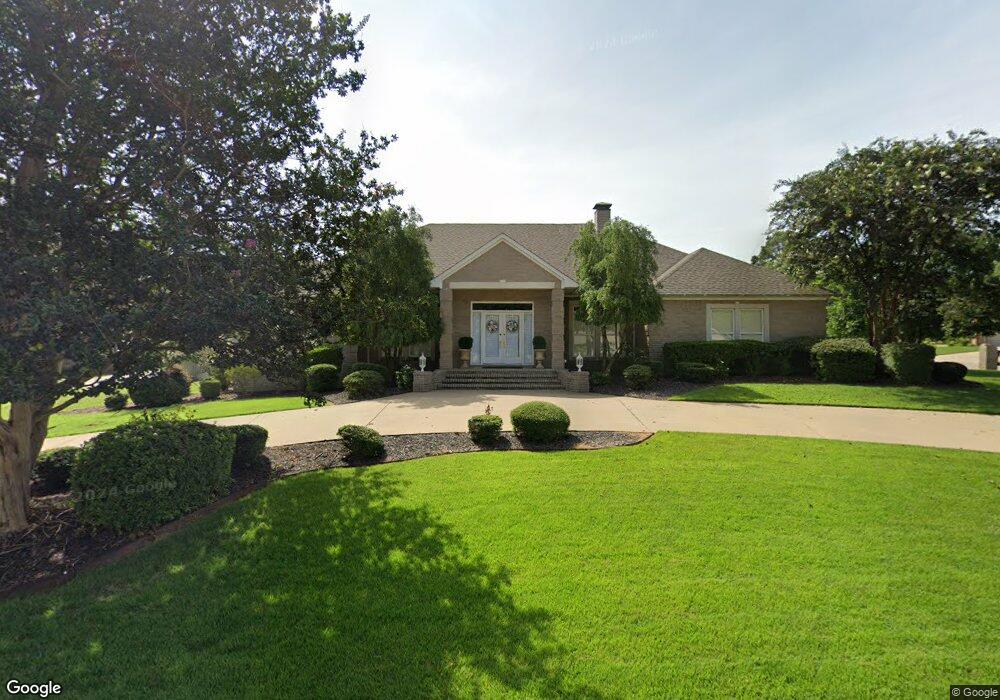
400 Wellesley Dr Unit 390 Conway, AR 72034
Southwest Conway NeighborhoodEstimated Value: $508,791 - $568,000
4
Beds
4
Baths
3,302
Sq Ft
$162/Sq Ft
Est. Value
About This Home
This home is located at 400 Wellesley Dr Unit 390, Conway, AR 72034 and is currently estimated at $534,448, approximately $161 per square foot. 400 Wellesley Dr Unit 390 is a home located in Faulkner County with nearby schools including Marguerite Vann Elementary School, Carl Stuart Middle School, and Conway Junior High School.
Ownership History
Date
Name
Owned For
Owner Type
Purchase Details
Closed on
Mar 16, 2020
Sold by
Naylor David L and Naylor Mary Jane
Bought by
Naylor David L and Naylor Mary J
Current Estimated Value
Purchase Details
Closed on
May 13, 2010
Sold by
Seideman Stephen B and Seideman Barbara H
Bought by
Naylor David L and Naylor Mary Jane
Home Financials for this Owner
Home Financials are based on the most recent Mortgage that was taken out on this home.
Original Mortgage
$158,500
Outstanding Balance
$106,080
Interest Rate
5.02%
Mortgage Type
New Conventional
Estimated Equity
$428,368
Purchase Details
Closed on
Mar 20, 2006
Bought by
Seidman Trust
Purchase Details
Closed on
Mar 14, 2006
Bought by
Seidman Trust
Purchase Details
Closed on
Oct 3, 2002
Bought by
Bartos Trust
Purchase Details
Closed on
May 28, 1999
Bought by
Bartos
Create a Home Valuation Report for This Property
The Home Valuation Report is an in-depth analysis detailing your home's value as well as a comparison with similar homes in the area
Home Values in the Area
Average Home Value in this Area
Purchase History
| Date | Buyer | Sale Price | Title Company |
|---|---|---|---|
| Naylor David L | -- | None Available | |
| Naylor David L | $289,000 | -- | |
| Seidman Trust | $321,000 | -- | |
| Seidman Trust | $321,000 | -- | |
| Bartos Trust | -- | -- | |
| Bartos | $47,000 | -- |
Source: Public Records
Mortgage History
| Date | Status | Borrower | Loan Amount |
|---|---|---|---|
| Open | Naylor David L | $158,500 |
Source: Public Records
Tax History Compared to Growth
Tax History
| Year | Tax Paid | Tax Assessment Tax Assessment Total Assessment is a certain percentage of the fair market value that is determined by local assessors to be the total taxable value of land and additions on the property. | Land | Improvement |
|---|---|---|---|---|
| 2025 | $3,005 | $105,220 | $7,600 | $97,620 |
| 2024 | $3,005 | $105,220 | $7,600 | $97,620 |
| 2023 | $3,005 | $74,910 | $7,600 | $67,310 |
| 2022 | $2,630 | $74,910 | $7,600 | $67,310 |
| 2021 | $2,910 | $74,910 | $7,600 | $67,310 |
| 2020 | $2,754 | $61,840 | $7,600 | $54,240 |
| 2019 | $2,754 | $61,840 | $7,600 | $54,240 |
| 2018 | $2,779 | $61,840 | $7,600 | $54,240 |
| 2017 | $2,779 | $61,840 | $7,600 | $54,240 |
| 2016 | $2,779 | $61,840 | $7,600 | $54,240 |
| 2015 | $3,005 | $59,390 | $7,600 | $51,790 |
| 2014 | $2,655 | $59,390 | $7,600 | $51,790 |
Source: Public Records
Map
Nearby Homes
- 3107 Stermer Rd
- 387 Pippinpost Dr
- 3065 Cottontop Rd
- 3600 Dave Ward Dr
- 12 Chester Cove
- 1 Manchester Dr
- Lot 6 Orchard Hill Ph 4
- 950 Mattison Rd
- 145 Willow Springs Dr
- 3350 Sylvia Springs Dr
- 115 Willow Springs Dr
- 297 Southwick Cove
- 150 Magnolia Springs Dr
- 3495 Cutter Ridge Rd
- 2765 Carl Stuart St
- 2759 Carl Stuart St
- 905 Wineberry
- 207 Fairway Dr
- 925 Wineberry
- 3237 College Ave
- 420 Wellesley Dr
- 370 Wellesley Dr
- 395 Wellesley Dr
- 375 Wellesley Dr
- 435 Wellesley Dr
- 440 Wellesley Dr
- 3190 Stermer Rd
- 455 Wellesley Dr
- 335 Wellesley Dr
- 3180 Stermer Rd
- 460 Wellesley Dr
- 330 Wellesley Dr
- 3110 Stermer Rd
- 310 Wellesley Dr
- 0 Wellesley Unit 16019587
- 0 Wellesley Unit 20035925
- 0 Wellesley Unit 17035301
- 2695 Overcup Dr
- 347 Pippinpost Dr
- 349 Pippinpost Dr