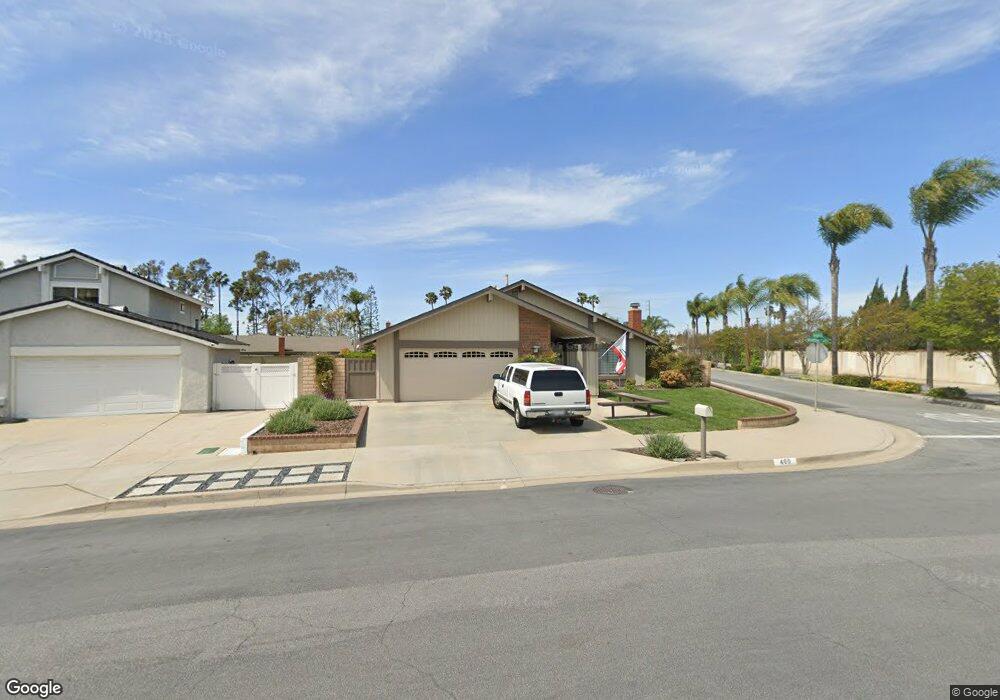
400 Windflower Ln Placentia, CA 92870
Estimated Value: $1,150,000 - $1,434,000
5
Beds
3
Baths
2,607
Sq Ft
$498/Sq Ft
Est. Value
About This Home
This home is located at 400 Windflower Ln, Placentia, CA 92870 and is currently estimated at $1,299,430, approximately $498 per square foot. 400 Windflower Ln is a home located in Orange County with nearby schools including Morse Avenue Elementary School, Kraemer Middle School, and Valencia High School.
Ownership History
Date
Name
Owned For
Owner Type
Purchase Details
Closed on
Jun 2, 2008
Sold by
Kilian Stephen C and Kilian Janice M
Bought by
Kilian Stephen Craig and Kilian Janice Meyer
Current Estimated Value
Create a Home Valuation Report for This Property
The Home Valuation Report is an in-depth analysis detailing your home's value as well as a comparison with similar homes in the area
Home Values in the Area
Average Home Value in this Area
Purchase History
| Date | Buyer | Sale Price | Title Company |
|---|---|---|---|
| Kilian Stephen Craig | -- | None Available |
Source: Public Records
Tax History
| Year | Tax Paid | Tax Assessment Tax Assessment Total Assessment is a certain percentage of the fair market value that is determined by local assessors to be the total taxable value of land and additions on the property. | Land | Improvement |
|---|---|---|---|---|
| 2025 | $2,645 | $176,630 | $27,434 | $149,196 |
| 2024 | $2,645 | $173,167 | $26,896 | $146,271 |
| 2023 | $2,563 | $169,772 | $26,369 | $143,403 |
| 2022 | $2,487 | $166,444 | $25,852 | $140,592 |
| 2021 | $2,396 | $163,181 | $25,345 | $137,836 |
| 2020 | $2,401 | $161,508 | $25,085 | $136,423 |
| 2019 | $2,294 | $158,342 | $24,593 | $133,749 |
| 2018 | $2,259 | $155,238 | $24,111 | $131,127 |
| 2017 | $2,217 | $152,195 | $23,639 | $128,556 |
| 2016 | $2,174 | $149,211 | $23,175 | $126,036 |
| 2015 | $2,141 | $146,970 | $22,827 | $124,143 |
| 2014 | $2,086 | $144,092 | $22,380 | $121,712 |
Source: Public Records
Map
Nearby Homes
- 921 Azalea Ave
- 1256 N Vecino Ln
- 211 Doverfield Dr Unit 57
- 548 Vanderbilt Dr
- 554 Vanderbilt Dr
- 937 Finnell Way
- 410 N Angelina Dr
- 549 Fordham Dr
- 1126 Naples Ave
- 331 N Bradford Ave
- 731 Langer Dr
- 1410 Via Cortez
- 337 E Chapman Ave
- 513 W Madison Ave
- 518 Sheree Ln
- 1418 Avenida de Vaca
- 324 Rio Grande Ave
- 102 Kauai Ln
- 718 Kenoak Dr
- 205 Oahu Way
- 404 Windflower Ln
- 311 Lavender Ln
- 317 Lavender Ln
- 305 Lavender Ln
- 344 Bluebell Ave
- 338 Bluebell Ave
- 408 Windflower Ln
- 325 Lavender Ln
- 332 Bluebell Ave
- 401 Windflower Ln
- 407 Windflower Ln
- 331 Lavender Ln
- 406 Bluebell Ave
- 326 Bluebell Ave
- 412 Windflower Ln
- 415 Windflower Cir
- 320 Bluebell Ave
- 412 Bluebell Ave
- 337 Lavender Ln
- 312 Lavender Ln
Your Personal Tour Guide
Ask me questions while you tour the home.