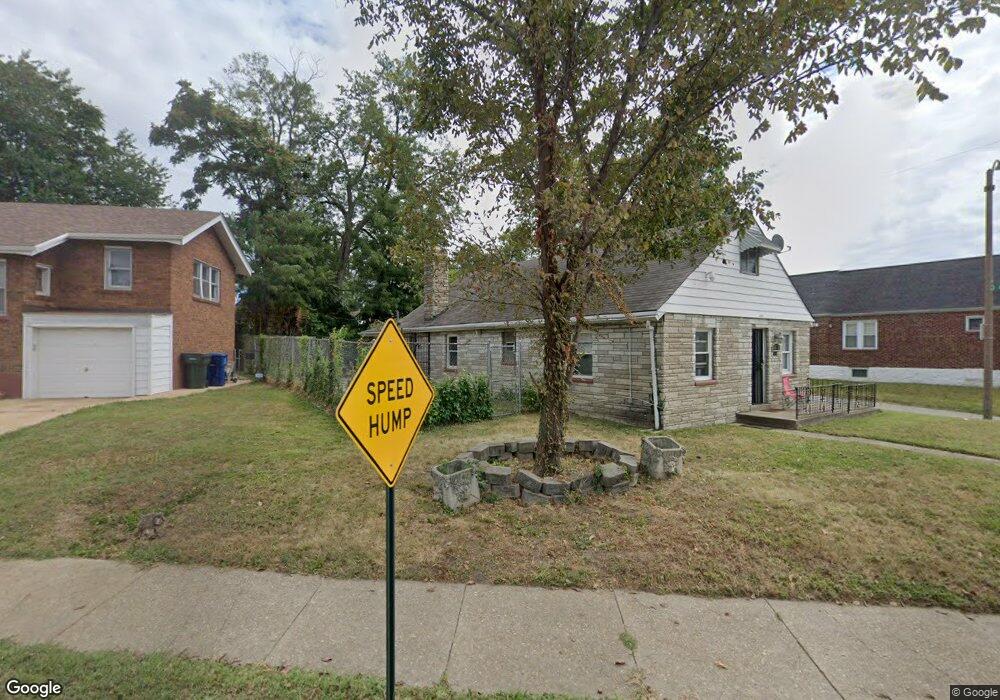
4000 Darby St Saint Louis, MO 63120
Estimated Value: $48,000 - $58,846
2
Beds
1
Bath
840
Sq Ft
$61/Sq Ft
Est. Value
About This Home
This home is located at 4000 Darby St, Saint Louis, MO 63120 and is currently estimated at $51,212, approximately $60 per square foot. 4000 Darby St is a home located in St. Louis City with nearby schools including Laclede Elementary School, Sumner High School, and Aspire Academy.
Ownership History
Date
Name
Owned For
Owner Type
Purchase Details
Closed on
Dec 5, 2014
Sold by
Boyd Karen
Bought by
I Got It At Mrs Neepys Llc
Current Estimated Value
Purchase Details
Closed on
Dec 17, 2010
Sold by
Corleon Bill E and Boyd Annice
Bought by
Boyd Karen
Purchase Details
Closed on
Sep 29, 2010
Sold by
Astound Properties Llc
Bought by
Corleon Bill E and Boyd Annice
Purchase Details
Closed on
Mar 11, 2010
Sold by
Stonecrest Income & Opportunity Fund I L
Bought by
Astound Properties Llc
Purchase Details
Closed on
Jan 2, 2010
Sold by
Blue Spruce Entities Llc
Bought by
Stonecrest Income & Opportunity Fund I L
Purchase Details
Closed on
Jan 1, 2010
Sold by
Nationstar Mortgage Llc
Bought by
Blue Spruce Entities Llc
Purchase Details
Closed on
Nov 3, 2009
Sold by
Riggs Michael R and Riggs Andrea R
Bought by
Nationstar Mortgage Llc
Purchase Details
Closed on
Feb 15, 2005
Sold by
Heffner Jonell Williams
Bought by
Riggs Michael and Riggs Andrea
Create a Home Valuation Report for This Property
The Home Valuation Report is an in-depth analysis detailing your home's value as well as a comparison with similar homes in the area
Home Values in the Area
Average Home Value in this Area
Purchase History
| Date | Buyer | Sale Price | Title Company |
|---|---|---|---|
| I Got It At Mrs Neepys Llc | -- | Nations Title Agency Mo Inc | |
| Boyd Karen | -- | Nations Title Agency Mo Inc | |
| Corleon Bill E | -- | Nations Title Agency Mo Inc | |
| Astound Properties Llc | $7,950 | None Available | |
| Stonecrest Income & Opportunity Fund I L | $6,500 | None Available | |
| Blue Spruce Entities Llc | -- | None Available | |
| Nationstar Mortgage Llc | $12,675 | Mokan Title Services Llc | |
| Riggs Michael | -- | -- |
Source: Public Records
Tax History Compared to Growth
Tax History
| Year | Tax Paid | Tax Assessment Tax Assessment Total Assessment is a certain percentage of the fair market value that is determined by local assessors to be the total taxable value of land and additions on the property. | Land | Improvement |
|---|---|---|---|---|
| 2025 | $199 | $2,110 | $360 | $1,750 |
| 2024 | $190 | $2,040 | $360 | $1,680 |
| 2023 | $190 | $2,040 | $360 | $1,680 |
| 2022 | $194 | $2,010 | $360 | $1,650 |
| 2021 | $194 | $2,010 | $360 | $1,650 |
| 2020 | $190 | $1,980 | $360 | $1,620 |
| 2019 | $190 | $1,980 | $360 | $1,620 |
| 2018 | $193 | $1,960 | $360 | $1,600 |
| 2017 | $190 | $1,960 | $360 | $1,600 |
| 2016 | $272 | $2,910 | $860 | $2,050 |
| 2015 | $249 | $2,910 | $860 | $2,050 |
| 2014 | $312 | $2,910 | $860 | $2,050 |
| 2013 | -- | $3,750 | $860 | $2,890 |
Source: Public Records
Map
Nearby Homes
- 5817 Dressell Ave
- 4310 Dardenne Dr
- 6231 Dardanella Ave
- 34 Blakemore Place
- 6124 Otto Ave
- 6128 Bircher St
- 2505 Crescent Ave
- 4206 Rosewood Ave
- 3438 Pine Grove Ave
- 6206 Lorraine Ave
- 3429 Pine Grove Ave
- 3460 Oakdale Ave
- 3442 Oakdale Ave
- 6211 Westerhoff Ave
- 4230 Jennings Station Rd
- 4232 Jennings Station Rd
- 4119 Oakwood Ave
- 3604 Ridgedale Ave
- 2137 Kienlen Ave
- 2140 Crescent Ave
- 4008 Darby St
- 5957 Ferris Ave
- 5954 Mcarthur Ave
- 5950 Mcarthur Ave
- 5955 Ferris Ave
- 5962 Mcarthur Ave
- 5946 Mcarthur Ave
- 4005 Darby St
- 3749 Darby St
- 4007 Darby St
- 5953 Ferris Ave
- 5942 Mcarthur Ave
- 4011 Darby St
- 4018 Darby St
- 4015 Darby St
- 5947 Ferris Ave
- 5938 Mcarthur Ave
- 6005 Grimshaw Ave
- 4022 Darby St
- 5954 Ferris Ave