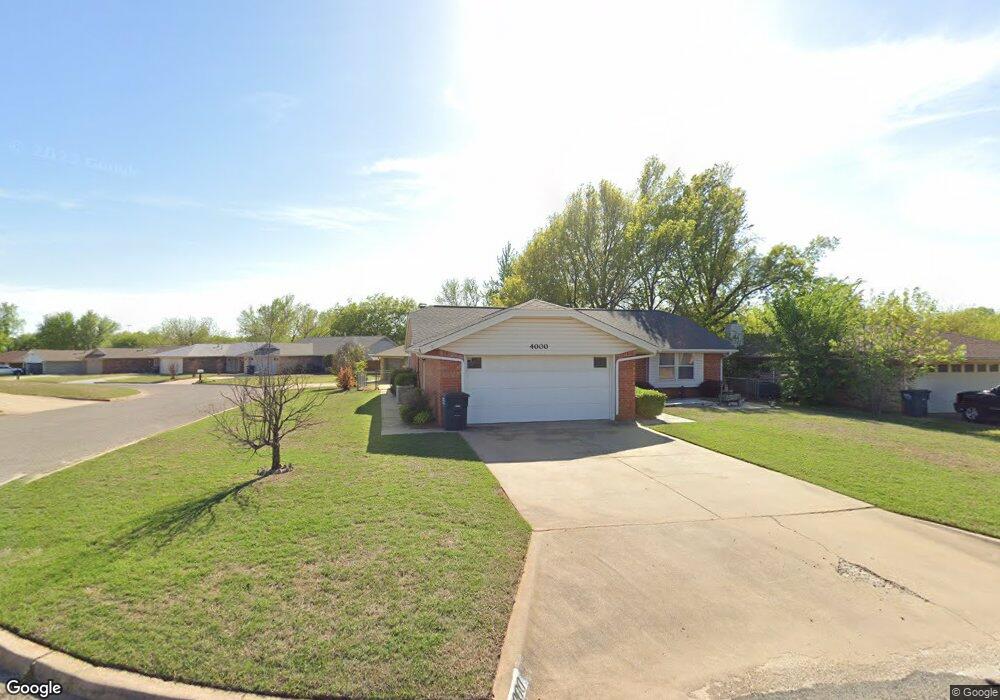
4000 N Pottenger Ave Shawnee, OK 74804
Estimated Value: $149,209 - $200,000
3
Beds
2
Baths
1,232
Sq Ft
$139/Sq Ft
Est. Value
About This Home
This home is located at 4000 N Pottenger Ave, Shawnee, OK 74804 and is currently estimated at $171,052, approximately $138 per square foot. 4000 N Pottenger Ave is a home located in Pottawatomie County with nearby schools including Will Rogers Elementary School, Shawnee Middle School, and Shawnee High School.
Ownership History
Date
Name
Owned For
Owner Type
Purchase Details
Closed on
Apr 2, 2024
Sold by
Cantrell Bruce Earl and Cantrell Beverly Jane
Bought by
Beverly Cantrell Properties Llc
Current Estimated Value
Purchase Details
Closed on
Jan 22, 2018
Sold by
Ballou Charlesy F and Ballou Brenda J
Bought by
Cantrell Bruce E and Cantrell Everly J
Purchase Details
Closed on
Dec 16, 2015
Sold by
Harrell Alva Dean
Bought by
209 East Walnut Llc
Purchase Details
Closed on
Aug 17, 2001
Sold by
Parker Archie and Parker Luree
Bought by
Harrell Elgan and Harrell Fernia
Purchase Details
Closed on
Mar 1, 2000
Sold by
Donahoo Vera
Bought by
Parker Archie and Parker Del
Purchase Details
Closed on
Jul 6, 1998
Sold by
Reid Ray and Reid Betty
Bought by
Donahoo Vera
Purchase Details
Closed on
Apr 19, 1994
Sold by
Nabors Elizabeth
Bought by
Reid Ray and Reid Betty
Create a Home Valuation Report for This Property
The Home Valuation Report is an in-depth analysis detailing your home's value as well as a comparison with similar homes in the area
Home Values in the Area
Average Home Value in this Area
Purchase History
| Date | Buyer | Sale Price | Title Company |
|---|---|---|---|
| Beverly Cantrell Properties Llc | -- | None Listed On Document | |
| Cantrell Bruce E | -- | Choice Title Insurance | |
| Ballou Charley F | -- | Chicago Title Ins | |
| 209 East Walnut Llc | $110,000 | First American Title | |
| Harrell Elgan | $85,000 | -- | |
| Parker Archie | $75,000 | -- | |
| Donahoo Vera | $71,500 | -- | |
| Reid Ray | $56,000 | -- |
Source: Public Records
Tax History Compared to Growth
Tax History
| Year | Tax Paid | Tax Assessment Tax Assessment Total Assessment is a certain percentage of the fair market value that is determined by local assessors to be the total taxable value of land and additions on the property. | Land | Improvement |
|---|---|---|---|---|
| 2025 | $976 | $9,951 | $1,200 | $8,751 |
| 2024 | $990 | $9,477 | $1,200 | $8,277 |
| 2023 | $990 | $9,477 | $1,200 | $8,277 |
| 2022 | $972 | $9,477 | $1,200 | $8,277 |
| 2021 | $955 | $9,477 | $1,200 | $8,277 |
| 2020 | $978 | $9,681 | $1,200 | $8,481 |
| 2019 | $1,011 | $9,681 | $1,200 | $8,481 |
| 2018 | $1,011 | $9,883 | $1,200 | $8,683 |
| 2017 | $1,018 | $10,086 | $1,200 | $8,886 |
| 2016 | $1,036 | $10,155 | $1,200 | $8,955 |
| 2015 | $885 | $9,846 | $1,200 | $8,646 |
| 2014 | $921 | $10,213 | $1,200 | $9,013 |
Source: Public Records
Map
Nearby Homes
- 4103 Pine Ridge Rd
- 29 Timber Creek Way
- 4206 N Aydelotte Ave
- 3 Rock Hollow Rd
- 7 N Tawana Dr
- 4408 N Chapman Ave
- 13 Robby Rd
- 312 Traditional Way Ct
- 1000 W 45th St
- 000 45th and Union Lot 1
- 000 45th and Union Lot 3
- 000 45th and Union Lot 2
- 000 45th and Union Lot 6
- 000 45th and Union Lot 4
- 000 45th and Union Lot 5
- 000 45th and Union Lot 7
- 216 W Georgia St
- 801 W Franklin St
- 4601 Pigeon Run
- 2106 N Aydelotte Ave
- 4008 N Pottenger Ave
- 4016 N Pottenger Ave
- 4002 N Pottenger Ave
- 3914 Marie Dr
- 4004 N Pottenger Ave
- 3910 N Pottenger Ave
- 3912 Marie Dr
- 4001 N Pottenger Ave
- 4003 N Pottenger Ave
- 3917 N Pottenger Ave
- 4006 N Pottenger Ave
- 4005 N Pottenger Ave
- 3907 Marie Dr
- 3913 N Pottenger Ave
- 4007 N Pottenger Ave
- 4001 Pine Ridge Rd
- 3908 Marie Dr
- 3908 N Pottenger Ave
- 3909 Pine Ridge Rd
- 4003 Pine Ridge Rd