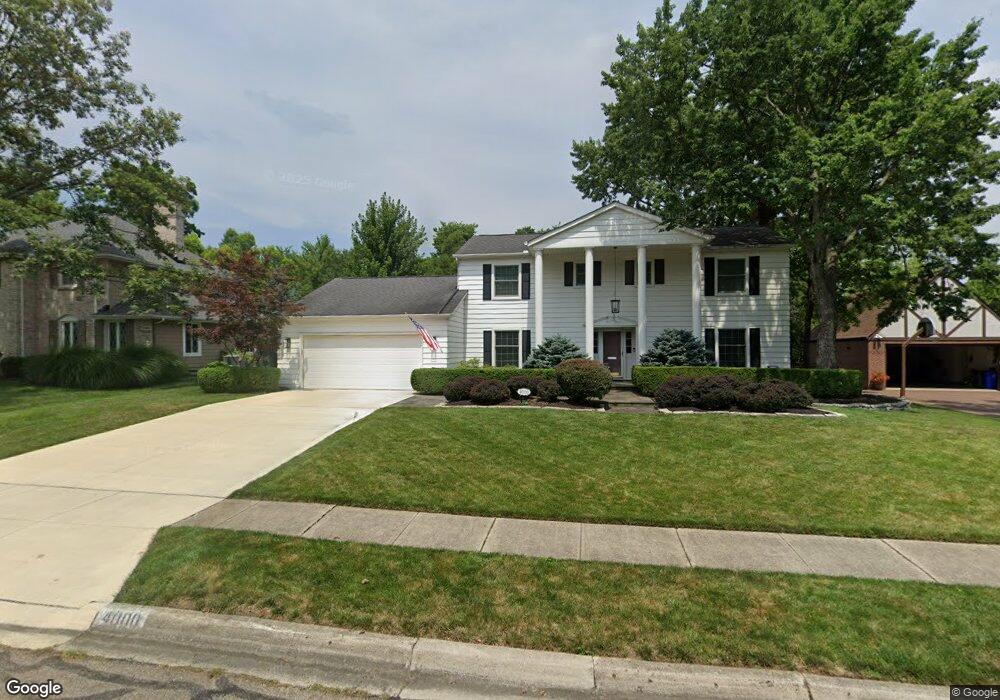
4000 Newhall Rd Columbus, OH 43220
Estimated Value: $778,000 - $904,000
4
Beds
3
Baths
2,633
Sq Ft
$323/Sq Ft
Est. Value
About This Home
This home is located at 4000 Newhall Rd, Columbus, OH 43220 and is currently estimated at $850,145, approximately $322 per square foot. 4000 Newhall Rd is a home located in Franklin County with nearby schools including Windermere Elementary School, Hastings Middle School, and Upper Arlington High School.
Ownership History
Date
Name
Owned For
Owner Type
Purchase Details
Closed on
Jan 31, 2006
Sold by
Barrett Scott V and Barrett Mara R
Bought by
Ferraro Michael V and Ferraro Kristen M
Current Estimated Value
Home Financials for this Owner
Home Financials are based on the most recent Mortgage that was taken out on this home.
Original Mortgage
$250,000
Interest Rate
6.37%
Mortgage Type
Fannie Mae Freddie Mac
Purchase Details
Closed on
Mar 11, 1999
Sold by
The Fifth Third Bank
Bought by
Barrett Scott V and Barrett Mara R
Home Financials for this Owner
Home Financials are based on the most recent Mortgage that was taken out on this home.
Original Mortgage
$255,500
Interest Rate
6.78%
Purchase Details
Closed on
Jun 19, 1998
Sold by
Boatright Ned C and Boatright Ann L
Bought by
The Fifth Third Bank
Purchase Details
Closed on
May 1, 1984
Create a Home Valuation Report for This Property
The Home Valuation Report is an in-depth analysis detailing your home's value as well as a comparison with similar homes in the area
Home Values in the Area
Average Home Value in this Area
Purchase History
| Date | Buyer | Sale Price | Title Company |
|---|---|---|---|
| Ferraro Michael V | $465,000 | Land Sel Ti | |
| Barrett Scott V | $300,700 | Franklin Abstract | |
| The Fifth Third Bank | $326,300 | Chicago Title | |
| -- | $165,000 | -- |
Source: Public Records
Mortgage History
| Date | Status | Borrower | Loan Amount |
|---|---|---|---|
| Closed | Ferraro Michael V | $250,000 | |
| Closed | Barrett Scott V | $255,500 |
Source: Public Records
Tax History Compared to Growth
Tax History
| Year | Tax Paid | Tax Assessment Tax Assessment Total Assessment is a certain percentage of the fair market value that is determined by local assessors to be the total taxable value of land and additions on the property. | Land | Improvement |
|---|---|---|---|---|
| 2024 | $14,711 | $246,750 | $74,550 | $172,200 |
| 2023 | $14,534 | $246,750 | $74,550 | $172,200 |
| 2022 | $13,865 | $198,420 | $53,970 | $144,450 |
| 2021 | $12,274 | $198,420 | $53,970 | $144,450 |
| 2020 | $12,165 | $198,420 | $53,970 | $144,450 |
| 2019 | $11,145 | $160,720 | $53,970 | $106,750 |
| 2018 | $9,952 | $146,830 | $53,970 | $92,860 |
| 2017 | $10,104 | $146,830 | $53,970 | $92,860 |
| 2016 | $9,764 | $147,670 | $34,970 | $112,700 |
| 2015 | $9,755 | $147,670 | $34,970 | $112,700 |
| 2014 | $9,766 | $147,670 | $34,970 | $112,700 |
| 2013 | $4,663 | $134,225 | $31,780 | $102,445 |
Source: Public Records
Map
Nearby Homes
- 4020 Ritamarie Dr
- 4115 Woodbridge Rd
- 3959 Woodbridge Rd
- 2300 Hoxton Ct
- 3509 Redding Rd
- 4450 Haverford Ct
- 1610 Lafayette Dr Unit 1610
- 1594 Lafayette Dr Unit 1594
- 2413 Edgevale Rd
- 1512 Lafayette Dr Unit B
- 2458 Edgevale Rd
- 3444 Sunningdale Way
- 2401 Shrewsbury Rd
- 3296 Leighton Rd
- 2225 Swansea Rd
- 1743 Ardleigh Rd Unit 1743
- 4740 Merrifield Place Unit 25
- 1842 Ridgecliff Rd
- 4765 Coach Rd
- 4543 Ducrest Dr
- 4010 Newhall Rd
- 3990 Newhall Rd
- 4021 Longhill Rd
- 4031 Longhill Rd
- 3983 Newhall Rd
- 4041 Longhill Rd
- 4001 Newhall Rd
- 4020 Newhall Rd
- 3978 Newhall Rd
- 4012 Longhill Rd
- 3988 Fenwick Rd
- 4040 Fenwick Rd
- 3977 Lytham Ct
- 4051 Longhill Rd
- 3969 Newhall Rd
- 3967 Lytham Ct
- 3966 Newhall Rd
- 4020 Longhill Rd
- 3976 Fenwick Rd
- 4040 Longhill Rd