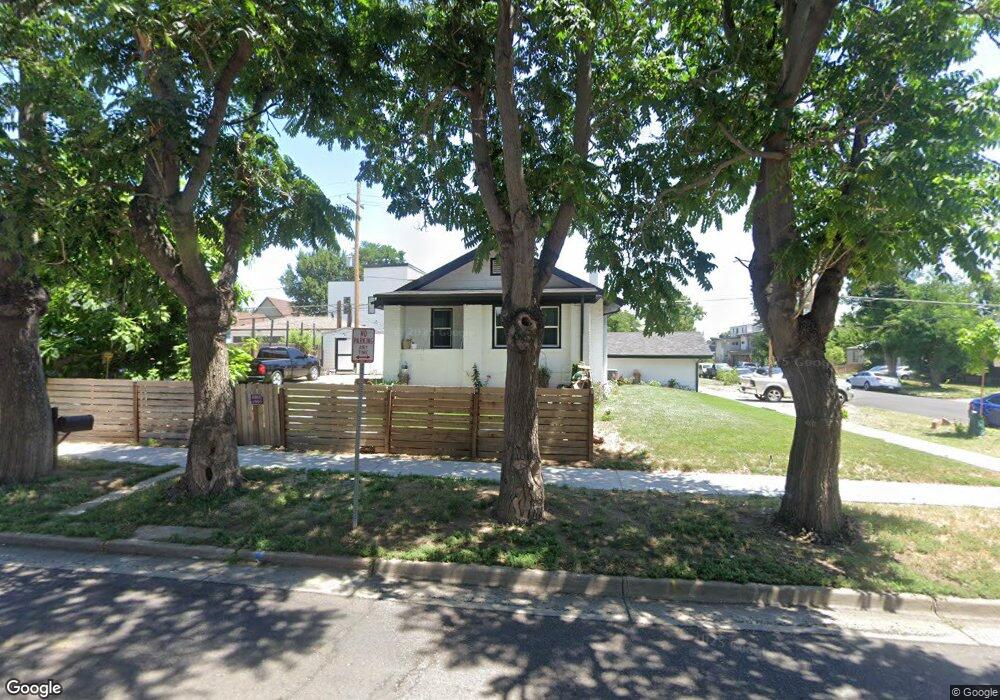
4000 Pecos St Denver, CO 80211
Sunnyside NeighborhoodEstimated Value: $537,000 - $578,000
2
Beds
1
Bath
872
Sq Ft
$638/Sq Ft
Est. Value
About This Home
This home is located at 4000 Pecos St, Denver, CO 80211 and is currently estimated at $556,667, approximately $638 per square foot. 4000 Pecos St is a home located in Denver County with nearby schools including Bryant Webster Dual Language School, Denver Montessori Junior/Senior High School, and Skinner Middle School.
Ownership History
Date
Name
Owned For
Owner Type
Purchase Details
Closed on
Jun 22, 2020
Sold by
Carrillo Alicia and Loera Gloria
Bought by
Franco Aurelia Loera and Mata Leonardo Javier
Current Estimated Value
Purchase Details
Closed on
Jul 18, 2014
Sold by
Lee Elroy B
Bought by
Lanier Claire S
Purchase Details
Closed on
May 16, 1997
Sold by
Duarte Abie R
Bought by
Carrillo Alicia and Loera Gloria
Home Financials for this Owner
Home Financials are based on the most recent Mortgage that was taken out on this home.
Original Mortgage
$72,495
Interest Rate
8.17%
Mortgage Type
FHA
Create a Home Valuation Report for This Property
The Home Valuation Report is an in-depth analysis detailing your home's value as well as a comparison with similar homes in the area
Home Values in the Area
Average Home Value in this Area
Purchase History
| Date | Buyer | Sale Price | Title Company |
|---|---|---|---|
| Franco Aurelia Loera | -- | None Available | |
| Lanier Claire S | $12,000 | None Available | |
| Carrillo Alicia | $72,450 | -- |
Source: Public Records
Mortgage History
| Date | Status | Borrower | Loan Amount |
|---|---|---|---|
| Previous Owner | Carrillo Alicia | $72,495 |
Source: Public Records
Tax History
| Year | Tax Paid | Tax Assessment Tax Assessment Total Assessment is a certain percentage of the fair market value that is determined by local assessors to be the total taxable value of land and additions on the property. | Land | Improvement |
|---|---|---|---|---|
| 2025 | $2,887 | $41,860 | $29,160 | $29,160 |
| 2024 | $2,887 | $36,450 | $24,030 | $12,420 |
| 2023 | $2,824 | $36,450 | $24,030 | $12,420 |
| 2022 | $2,376 | $29,880 | $28,750 | $1,130 |
| 2021 | $2,293 | $30,730 | $29,570 | $1,160 |
| 2020 | $2,312 | $31,160 | $29,570 | $1,590 |
| 2019 | $2,247 | $31,160 | $29,570 | $1,590 |
| 2018 | $2,092 | $27,040 | $26,060 | $980 |
| 2017 | $2,086 | $27,040 | $26,060 | $980 |
| 2016 | $1,695 | $20,790 | $9,257 | $11,533 |
| 2015 | $1,624 | $20,790 | $9,257 | $11,533 |
| 2014 | $1,121 | $13,500 | $3,701 | $9,799 |
Source: Public Records
Map
Nearby Homes
- 3939 Osage St
- 3931 Osage St
- 3922 Osage St
- 4035 Osage St
- 4045 Osage St
- 3247 Navajo St
- 3829 Osage St
- 3835 Pecos St
- 4105 Navajo St
- 3960 Mariposa St
- 4059 Quivas St
- 1851 W 41st Ave
- 3935 Lipan St
- 4032 Lipan St
- 3935 Shoshone St
- 3929 Shoshone St
- 3700 Osage St
- 3718 Mariposa St
- 4227 Mariposa St
- 1201 W 41st Ave
Your Personal Tour Guide
Ask me questions while you tour the home.