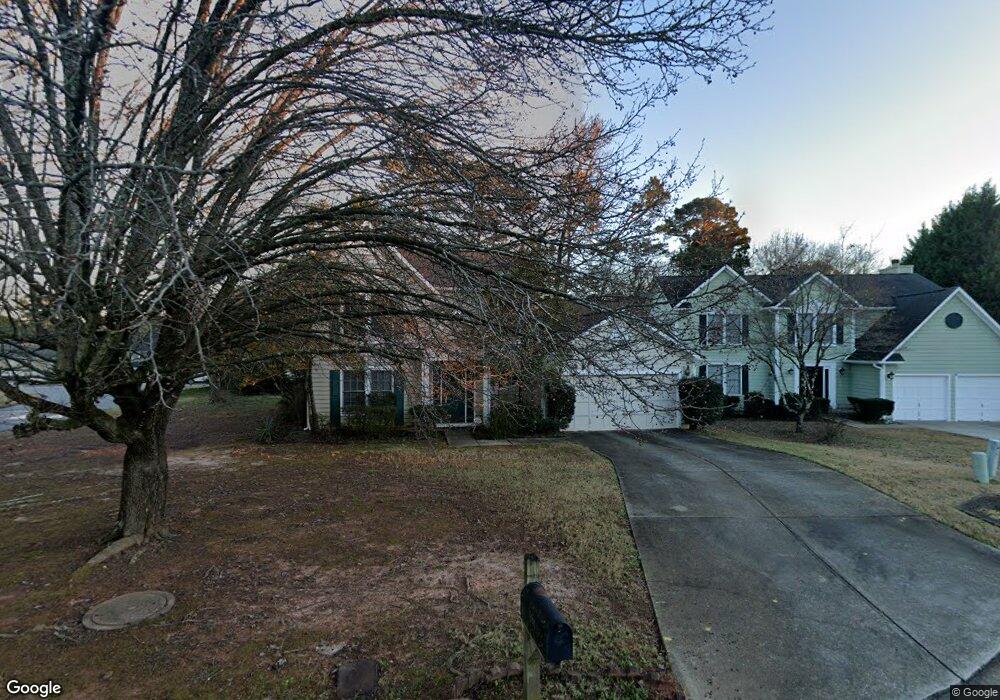
4000 Regatta Ct Unit 6 Duluth, GA 30096
Estimated Value: $390,952 - $437,000
4
Beds
3
Baths
1,796
Sq Ft
$228/Sq Ft
Est. Value
About This Home
This home is located at 4000 Regatta Ct Unit 6, Duluth, GA 30096 and is currently estimated at $408,738, approximately $227 per square foot. 4000 Regatta Ct Unit 6 is a home located in Gwinnett County with nearby schools including Charles Brant Chesney Elementary School, Duluth Middle School, and Duluth High School.
Ownership History
Date
Name
Owned For
Owner Type
Purchase Details
Closed on
Jun 2, 2006
Sold by
Willey Mark R
Bought by
Gonzalez-Rivera Otto
Current Estimated Value
Purchase Details
Closed on
Aug 18, 2000
Sold by
Gonzalez-Rivera Otto
Bought by
Willey Mark R
Purchase Details
Closed on
Feb 26, 1999
Sold by
Saylor David W and Saylor Denise C
Bought by
Willey Mark R and Willey Gonzalez-Riv
Home Financials for this Owner
Home Financials are based on the most recent Mortgage that was taken out on this home.
Original Mortgage
$135,880
Interest Rate
6.74%
Mortgage Type
FHA
Purchase Details
Closed on
Jul 27, 1995
Sold by
Barrett Gregory S Maria R
Bought by
Saylor David W Denise C
Purchase Details
Closed on
Oct 27, 1994
Sold by
Gelernter Sidney A Michele R
Bought by
Barrett Gregory S Maria R
Home Financials for this Owner
Home Financials are based on the most recent Mortgage that was taken out on this home.
Original Mortgage
$118,750
Interest Rate
8.68%
Create a Home Valuation Report for This Property
The Home Valuation Report is an in-depth analysis detailing your home's value as well as a comparison with similar homes in the area
Home Values in the Area
Average Home Value in this Area
Purchase History
We collect this data history from publicly available records. To have your information removed, we recommend requesting removal directly through your county’s website.
| Date | Buyer | Sale Price | Title Company |
|---|---|---|---|
| Gonzalez-Rivera Otto | -- | -- | |
| Willey Mark R | -- | -- | |
| Willey Mark R | $137,000 | -- | |
| Saylor David W Denise C | $126,000 | -- | |
| Barrett Gregory S Maria R | $125,000 | -- |
Source: Public Records
Mortgage History
We collect this data history from publicly available records. To have your information removed, we recommend requesting removal directly through your county’s website.
| Date | Status | Borrower | Loan Amount |
|---|---|---|---|
| Previous Owner | Willey Mark R | $135,880 | |
| Previous Owner | Barrett Gregory S Maria R | $118,750 | |
| Closed | Saylor David W Denise C | $0 |
Source: Public Records
Tax History
| Year | Tax Paid | Tax Assessment Tax Assessment Total Assessment is a certain percentage of the fair market value that is determined by local assessors to be the total taxable value of land and additions on the property. | Land | Improvement |
|---|---|---|---|---|
| 2025 | $5,751 | $152,920 | $29,920 | $123,000 |
| 2024 | $4,979 | $129,440 | $30,000 | $99,440 |
| 2023 | $4,979 | $121,680 | $26,000 | $95,680 |
| 2022 | $4,665 | $121,680 | $26,000 | $95,680 |
| 2021 | $3,453 | $86,320 | $20,000 | $66,320 |
| 2020 | $3,472 | $86,320 | $20,000 | $66,320 |
| 2019 | $3,345 | $86,320 | $20,000 | $66,320 |
| 2018 | $2,925 | $74,280 | $16,000 | $58,280 |
| 2016 | $2,672 | $66,560 | $15,200 | $51,360 |
| 2015 | $2,495 | $60,800 | $15,200 | $45,600 |
| 2014 | $2,458 | $59,400 | $12,000 | $47,400 |
Source: Public Records
Map
Nearby Homes
- 4085 Fastnet Ln Unit 3
- 4093 Howell Park Rd
- 4088 Howell Park Rd Unit 114
- 2820 Skye Terrace
- 4147 Howell Park Rd
- 4175 Howell Park Rd
- 3980 Howell Park Rd
- 4001 Howell Park Rd
- 3945 Genoa Ct
- 4166 Howell Park Rd
- 3977 Howell Park Rd
- 4025 Cranston Ct
- 4136 Buford Hwy
- 3487 Sorrel Ln
- 3914 Howell Park Rd Unit 5
- 4196 Buford Hwy
- 4248 Landington Ct
- 4429 Buckingham Place
- 4281 E Meadow Dr
- 4298 Buckingham Place
- 4010 Regatta Ct
- 4009 Admirals Ct
- 4020 Regatta Ct
- 4019 Admirals Ct Unit 5
- 3999 Admirals Ct
- 2867 Gravity Trail
- 2867 Gravitt Trail
- 4005 Regatta Ct
- 4029 Admirals Ct
- 4025 Regatta Ct
- 2877 Gravitt Trail
- 4015 Regatta Ct
- 4039 Admirals Ct
- 3989 Admirals Ct Unit 4
- 4004 Admirals Ct
- 4014 Admirals Ct Unit 5
- 2855 Gravitt Rd Unit 6
- 2882 Gravitt Trail
- 3994 Admirals Ct
- 3994 Admirals Ct Unit 74
Your Personal Tour Guide
Ask me questions while you tour the home.