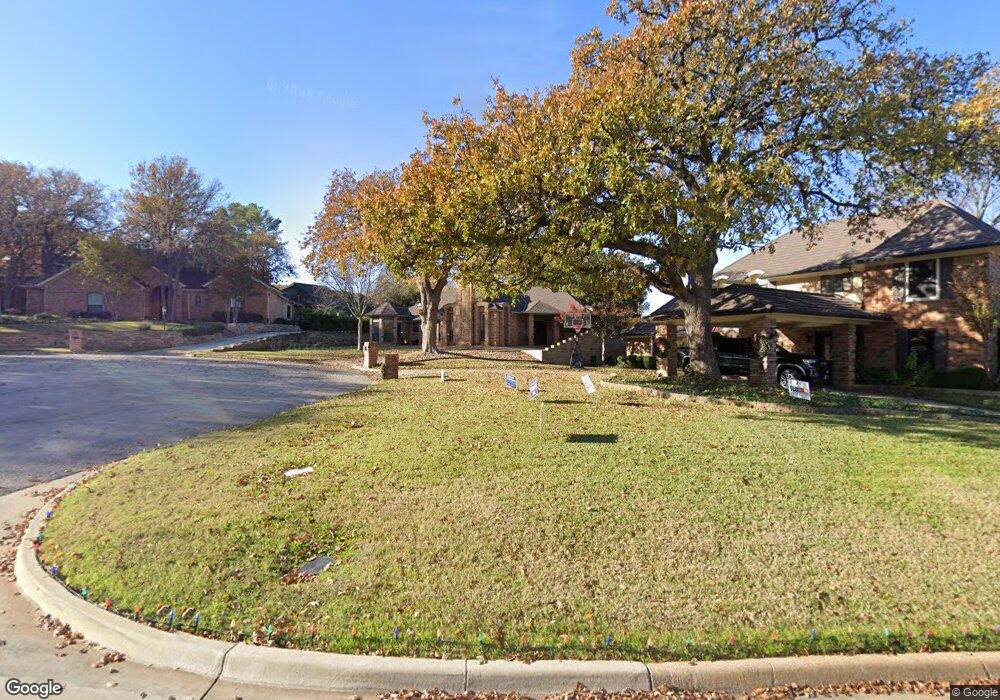
4000 Woodstock Dr Colleyville, TX 76034
Estimated Value: $676,325 - $725,000
4
Beds
3
Baths
2,836
Sq Ft
$248/Sq Ft
Est. Value
About This Home
This home is located at 4000 Woodstock Dr, Colleyville, TX 76034 and is currently estimated at $703,831, approximately $248 per square foot. 4000 Woodstock Dr is a home located in Tarrant County with nearby schools including Bransford Elementary School, Colleyville Middle School, and Covenant Christian Academy.
Ownership History
Date
Name
Owned For
Owner Type
Purchase Details
Closed on
Jul 30, 2018
Sold by
Lippincott Douglas A and Lippincott Deborah L
Bought by
Baxter Bruce R and Baxter Ryan L
Current Estimated Value
Home Financials for this Owner
Home Financials are based on the most recent Mortgage that was taken out on this home.
Original Mortgage
$332,000
Outstanding Balance
$203,258
Interest Rate
4.6%
Mortgage Type
Purchase Money Mortgage
Estimated Equity
$500,573
Purchase Details
Closed on
Aug 9, 1995
Sold by
Ippolito Rodolfo Moreno and Ippolito Alba Eloisa
Bought by
Lippincott Douglas A and Lippincott Deborah L
Home Financials for this Owner
Home Financials are based on the most recent Mortgage that was taken out on this home.
Original Mortgage
$143,900
Interest Rate
5.75%
Create a Home Valuation Report for This Property
The Home Valuation Report is an in-depth analysis detailing your home's value as well as a comparison with similar homes in the area
Home Values in the Area
Average Home Value in this Area
Purchase History
| Date | Buyer | Sale Price | Title Company |
|---|---|---|---|
| Baxter Bruce R | -- | Juniper Title | |
| Lippincott Douglas A | -- | First American Title Co |
Source: Public Records
Mortgage History
| Date | Status | Borrower | Loan Amount |
|---|---|---|---|
| Open | Baxter Bruce R | $332,000 | |
| Previous Owner | Lippincott Douglas A | $143,900 |
Source: Public Records
Tax History Compared to Growth
Tax History
| Year | Tax Paid | Tax Assessment Tax Assessment Total Assessment is a certain percentage of the fair market value that is determined by local assessors to be the total taxable value of land and additions on the property. | Land | Improvement |
|---|---|---|---|---|
| 2025 | $2,233 | $558,000 | $175,350 | $382,650 |
| 2024 | $2,233 | $588,847 | $175,350 | $413,497 |
| 2023 | $8,409 | $578,836 | $175,350 | $403,486 |
| 2022 | $8,951 | $532,000 | $175,350 | $356,650 |
| 2021 | $9,048 | $412,000 | $105,210 | $306,790 |
| 2020 | $9,155 | $412,000 | $105,210 | $306,790 |
| 2019 | $9,512 | $411,405 | $100,000 | $311,405 |
| 2018 | $2,204 | $370,758 | $100,000 | $270,758 |
| 2017 | $8,084 | $373,602 | $120,000 | $253,602 |
| 2016 | $7,349 | $336,374 | $80,000 | $256,374 |
| 2015 | $6,356 | $282,800 | $35,000 | $247,800 |
| 2014 | $6,356 | $282,800 | $35,000 | $247,800 |
Source: Public Records
Map
Nearby Homes
- 3907 Windermere Dr
- 2204 Woodstock Dr
- 3827 Ashbury Ln
- 2001 Oak Knoll Dr
- 3813 Brookridge Ct
- 1820 Wimbleton Dr
- 1421 Plantation Dr N
- Seaberry II Plan at Grace Park - Signature Series
- Primrose FE V Plan at Grace Park - Signature Series
- Hawthorne Plan at Grace Park - Signature Series
- Seaberry Plan at Grace Park - Signature Series
- Gardenia Plan at Grace Park - Signature Series
- Bellflower IV Plan at Grace Park - Signature Series
- Bellflower II Plan at Grace Park - Signature Series
- Carolina IV Plan at Grace Park - Signature Series
- Carolina Plan at Grace Park - Signature Series
- Violet III Plan at Grace Park - Signature Series
- Violet IV Plan at Grace Park - Signature Series
- Magnolia III Plan at Grace Park - Signature Series
- Violet II Plan at Grace Park - Signature Series
- 3912 Woodstock Dr
- 4002 Woodstock Dr
- 4001 Windermere Dr
- 1905 Woodstock Dr
- 3910 Woodstock Dr
- 1904 Ashton Ct
- 1903 Woodstock Dr
- 1908 Ashton Ct
- 4003 Woodstock Dr
- 3908 Woodstock Dr
- 4001 Woodstock Dr
- 3913 Woodstock Dr
- 4007 Woodstock Dr
- 1913 Ashton Ct
- 3911 Woodstock Dr
- 1904 Woodstock Dr
- 4009 Woodstock Dr
- 4000 Windermere Dr
- 3906 Woodstock Dr
- 1902 Woodstock Dr