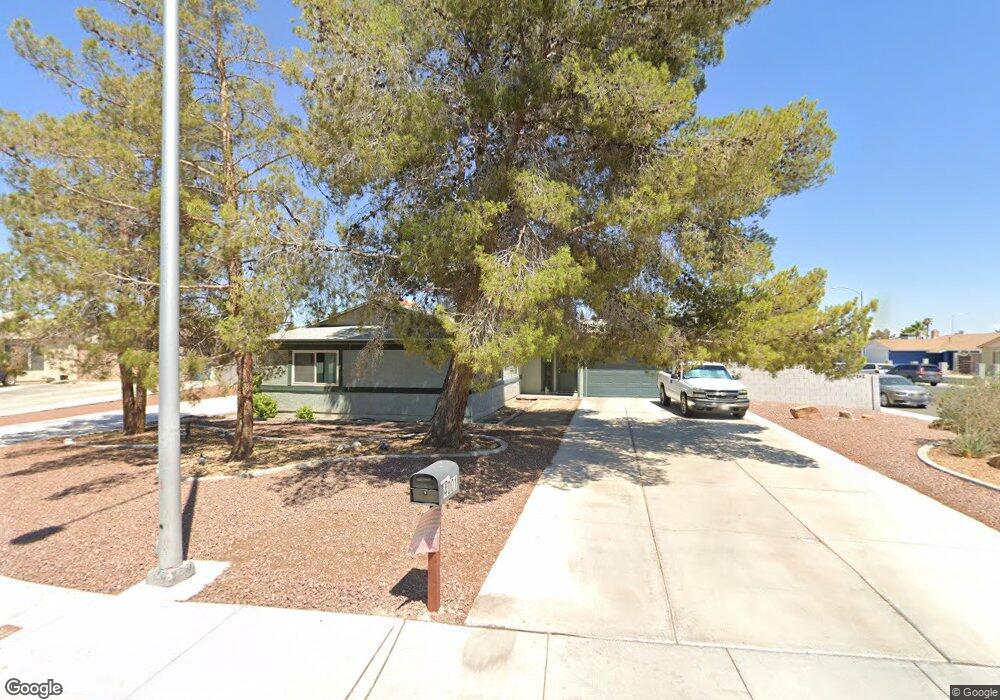
4001 Halco Ct Las Vegas, NV 89108
Woodcrest NeighborhoodEstimated Value: $383,000 - $410,000
4
Beds
2
Baths
1,338
Sq Ft
$297/Sq Ft
Est. Value
About This Home
This home is located at 4001 Halco Ct, Las Vegas, NV 89108 and is currently estimated at $397,691, approximately $297 per square foot. 4001 Halco Ct is a home located in Clark County with nearby schools including R.E. Tobler Elementary School, Justice Myron E Leavitt Middle School, and Centennial High School.
Ownership History
Date
Name
Owned For
Owner Type
Purchase Details
Closed on
Mar 18, 2021
Sold by
Gross Debra
Bought by
Gross Fred Robert and Puig Gross Debra
Current Estimated Value
Purchase Details
Closed on
Feb 9, 2004
Sold by
Gross Fred R
Bought by
Gross Debra
Purchase Details
Closed on
Dec 31, 1998
Sold by
Gross Fred Robert and Gross Debra
Bought by
Gross Fred R and Gross Debra
Home Financials for this Owner
Home Financials are based on the most recent Mortgage that was taken out on this home.
Original Mortgage
$90,950
Interest Rate
6.73%
Purchase Details
Closed on
May 13, 1994
Sold by
Foster Kenneth J and Foster Judy B
Bought by
Gross Fred Robert and Gross Debra
Home Financials for this Owner
Home Financials are based on the most recent Mortgage that was taken out on this home.
Original Mortgage
$80,800
Interest Rate
8.1%
Create a Home Valuation Report for This Property
The Home Valuation Report is an in-depth analysis detailing your home's value as well as a comparison with similar homes in the area
Home Values in the Area
Average Home Value in this Area
Purchase History
| Date | Buyer | Sale Price | Title Company |
|---|---|---|---|
| Gross Fred Robert | -- | None Available | |
| Gross Debra | -- | United Title Of Nevada | |
| Gross Fred R | -- | Ati Title | |
| Gross Fred Robert | $98,500 | Stewart Title |
Source: Public Records
Mortgage History
| Date | Status | Borrower | Loan Amount |
|---|---|---|---|
| Previous Owner | Gross Fred R | $90,950 | |
| Previous Owner | Gross Fred Robert | $80,800 |
Source: Public Records
Tax History Compared to Growth
Tax History
| Year | Tax Paid | Tax Assessment Tax Assessment Total Assessment is a certain percentage of the fair market value that is determined by local assessors to be the total taxable value of land and additions on the property. | Land | Improvement |
|---|---|---|---|---|
| 2025 | $1,182 | $64,972 | $36,120 | $28,852 |
| 2024 | $1,148 | $64,972 | $36,120 | $28,852 |
| 2023 | $1,148 | $67,653 | $39,060 | $28,593 |
| 2022 | $1,115 | $53,444 | $26,880 | $26,564 |
| 2021 | $1,082 | $50,764 | $25,200 | $25,564 |
| 2020 | $1,048 | $49,646 | $23,940 | $25,706 |
| 2019 | $1,035 | $47,544 | $21,840 | $25,704 |
| 2018 | $988 | $42,156 | $17,220 | $24,936 |
| 2017 | $1,400 | $42,713 | $17,220 | $25,493 |
| 2016 | $926 | $37,076 | $10,920 | $26,156 |
| 2015 | $923 | $30,840 | $6,300 | $24,540 |
| 2014 | $896 | $32,021 | $8,750 | $23,271 |
Source: Public Records
Map
Nearby Homes
- 3948 Applecrest St
- 4012 Mira Ln
- 3936 Applecrest St Unit 1
- 3929 Dream St
- 6429 Roy Rogers Dr Unit 2
- 6553 Beacon Rd
- 6465 Plumcrest Rd
- 6556 Gatehouse Ln
- 6604 Gatehouse Ln
- 3805 Twig Ln
- 6641 Telegraph Rd
- 6645 Telegraph Rd
- 4217 Jasper Ave
- 4229 Jadestone Ave
- 4113 Compass Rose Way
- 6609 Joe Michael Way
- 3757 N Torrey Pines Dr
- 4232 Orangeblossom Ct
- 6660 Joe Michael Way
- 4252 Orangeblossom St
- 6516 Miragrande Dr
- 4005 Halco Ct
- 4000 Halco Ct
- 6521 Miragrande Dr
- 4000 Mira Ln
- 4008 Halco Ct
- 6525 Miragrande Dr
- 4004 Mira Ln
- 6517 Miragrande Dr Unit 3
- 6529 Miragrande Dr
- 4008 Mira Ln
- 6513 Miragrande Dr
- 4004 Halco Ct
- 6536 Miragrande Dr
- 6533 Miragrande Dr
- 6513 Ouida Way
- 6517 Ouida Way
- 4012 Mira Ln Unit na
- 6509 Ouida Way
- 6521 Ouida Way