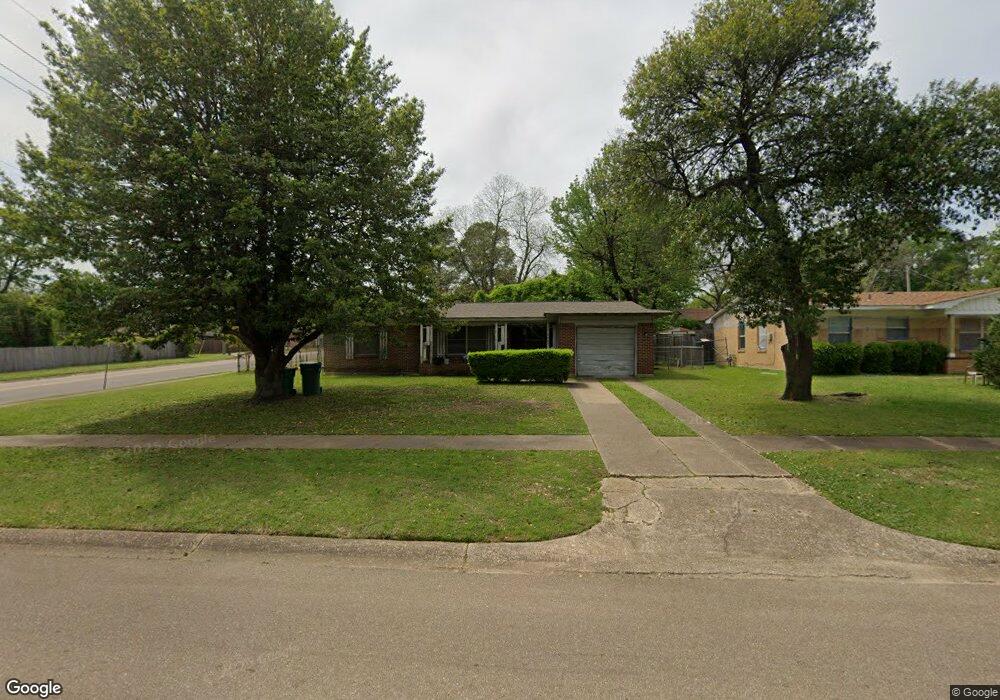
4001 N Park Rd Texarkana, TX 75503
Estimated Value: $144,936 - $162,000
--
Bed
--
Bath
1,297
Sq Ft
$119/Sq Ft
Est. Value
About This Home
This home is located at 4001 N Park Rd, Texarkana, TX 75503 and is currently estimated at $153,984, approximately $118 per square foot. 4001 N Park Rd is a home located in Bowie County with nearby schools including Spring Lake Park Elementary School, Texas Middle School, and Texas High School.
Ownership History
Date
Name
Owned For
Owner Type
Purchase Details
Closed on
Sep 8, 2022
Sold by
Vasquez Lizbeth and Vasquez Juan Carlos
Bought by
Cornelio Ana and Mendoza Alexia Lynn
Current Estimated Value
Purchase Details
Closed on
Sep 28, 2012
Sold by
Olvera Regulo and Olvera Julissa
Bought by
Vasquez Lizabeth
Home Financials for this Owner
Home Financials are based on the most recent Mortgage that was taken out on this home.
Original Mortgage
$63,000
Interest Rate
3.7%
Mortgage Type
Purchase Money Mortgage
Purchase Details
Closed on
May 30, 2012
Sold by
Federal National Mortgage Association
Bought by
Olvera Regulo
Home Financials for this Owner
Home Financials are based on the most recent Mortgage that was taken out on this home.
Original Mortgage
$46,750
Interest Rate
3.8%
Mortgage Type
Purchase Money Mortgage
Create a Home Valuation Report for This Property
The Home Valuation Report is an in-depth analysis detailing your home's value as well as a comparison with similar homes in the area
Home Values in the Area
Average Home Value in this Area
Purchase History
| Date | Buyer | Sale Price | Title Company |
|---|---|---|---|
| Cornelio Ana | -- | Southwest Title | |
| Vasquez Lizabeth | -- | Stewart Title Of Texarkana | |
| Olvera Regulo | -- | Brahmn Title & Escrow Llc |
Source: Public Records
Mortgage History
| Date | Status | Borrower | Loan Amount |
|---|---|---|---|
| Previous Owner | Vasquez Lizabeth | $63,000 | |
| Previous Owner | Olvera Regulo | $46,750 |
Source: Public Records
Tax History Compared to Growth
Tax History
| Year | Tax Paid | Tax Assessment Tax Assessment Total Assessment is a certain percentage of the fair market value that is determined by local assessors to be the total taxable value of land and additions on the property. | Land | Improvement |
|---|---|---|---|---|
| 2025 | $1,485 | $140,160 | $12,500 | $127,660 |
| 2024 | $1,485 | $136,436 | $12,500 | $123,936 |
| 2023 | $2,979 | $125,820 | $12,500 | $113,320 |
| 2022 | $2,654 | $111,188 | $10,000 | $101,188 |
| 2021 | $2,434 | $95,168 | $10,000 | $85,168 |
| 2020 | $2,342 | $91,110 | $10,000 | $81,110 |
| 2019 | $2,327 | $87,250 | $10,000 | $77,250 |
| 2018 | $1,833 | $68,713 | $10,000 | $58,713 |
| 2017 | $1,749 | $65,764 | $10,000 | $55,764 |
| 2016 | $1,706 | $64,144 | $10,000 | $54,144 |
| 2015 | $1,632 | $63,607 | $10,000 | $53,607 |
| 2014 | $1,632 | $63,080 | $10,000 | $53,080 |
Source: Public Records
Map
Nearby Homes
- 4003 N Park Rd
- 3921 Sabine Ave
- 4005 N Park Rd
- 4002 N Park Rd
- 3924 Sabine Ave
- 4004 Rio Grande Ave
- 4004 N Park Rd
- 3919 Sabine Ave
- 4002 Rio Grande Ave
- 1123 W 40th St
- 3922 Sabine Ave
- 4007 N Park Rd
- 4006 N Park Rd
- 3920 Sabine Ave
- 4008 Rio Grande Ave
- 4001 Rio Grande Ave
- 4008 N Park Rd
- 3920 Rio Grande Ave
- 3917 Sabine Ave
- 3918 Sabine Ave