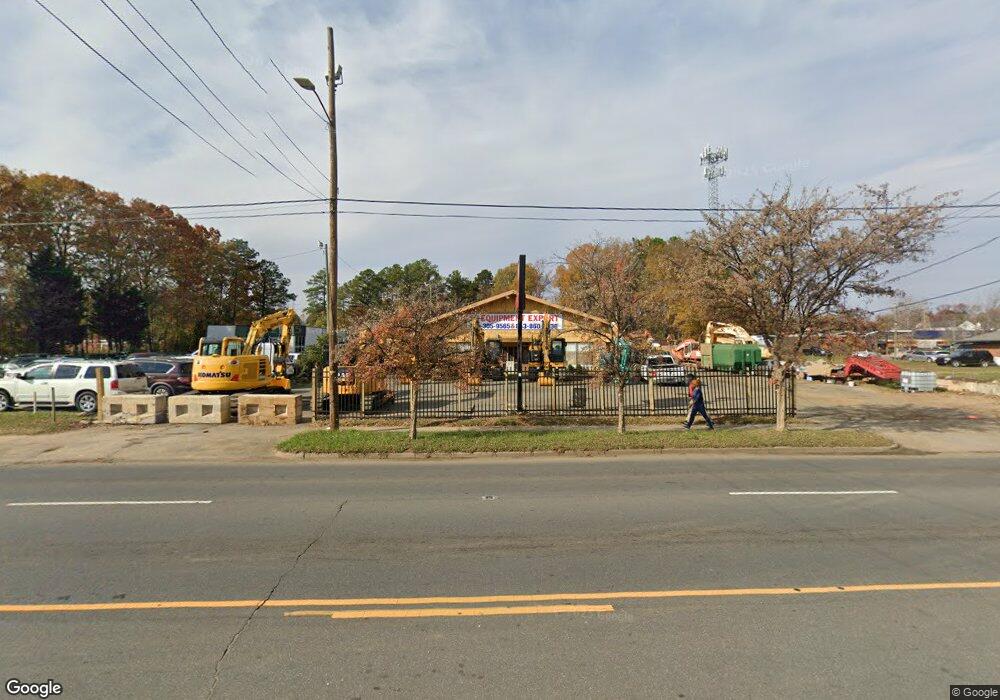
4001 N Tryon St Charlotte, NC 28206
Sugar Creek NeighborhoodEstimated Value: $1,261,644
--
Bed
--
Bath
5,032
Sq Ft
$251/Sq Ft
Est. Value
About This Home
This home is located at 4001 N Tryon St, Charlotte, NC 28206 and is currently estimated at $1,261,644, approximately $250 per square foot. 4001 N Tryon St is a home located in Mecklenburg County with nearby schools including Highland Renaissance Academy, Martin Luther King Jr Middle, and Garinger High School.
Ownership History
Date
Name
Owned For
Owner Type
Purchase Details
Closed on
Feb 3, 2014
Sold by
Td Machinery Export Llc
Bought by
Central Collinion Inc
Current Estimated Value
Purchase Details
Closed on
Apr 11, 2012
Sold by
Central Collision Incorporated
Bought by
Td Machinery Export Llc
Purchase Details
Closed on
Oct 19, 2010
Sold by
Tsifra Vasiliy and Tsifra Anna
Bought by
Central Collission Incorporated
Home Financials for this Owner
Home Financials are based on the most recent Mortgage that was taken out on this home.
Original Mortgage
$336,000
Interest Rate
4.39%
Mortgage Type
Future Advance Clause Open End Mortgage
Purchase Details
Closed on
Mar 1, 1998
Sold by
Chau Nam My and Vuu Phuong Thi
Bought by
Tsifra Vasiliy and Tsifra Anna
Home Financials for this Owner
Home Financials are based on the most recent Mortgage that was taken out on this home.
Original Mortgage
$138,000
Interest Rate
7.06%
Mortgage Type
Commercial
Create a Home Valuation Report for This Property
The Home Valuation Report is an in-depth analysis detailing your home's value as well as a comparison with similar homes in the area
Home Values in the Area
Average Home Value in this Area
Purchase History
| Date | Buyer | Sale Price | Title Company |
|---|---|---|---|
| Central Collinion Inc | -- | None Available | |
| Td Machinery Export Llc | -- | None Available | |
| Central Collission Incorporated | $425,000 | None Available | |
| Tsifra Vasiliy | $184,000 | -- |
Source: Public Records
Mortgage History
| Date | Status | Borrower | Loan Amount |
|---|---|---|---|
| Previous Owner | Central Collission Incorporated | $336,000 | |
| Previous Owner | Tsifra Vasiliy | $138,000 |
Source: Public Records
Tax History Compared to Growth
Tax History
| Year | Tax Paid | Tax Assessment Tax Assessment Total Assessment is a certain percentage of the fair market value that is determined by local assessors to be the total taxable value of land and additions on the property. | Land | Improvement |
|---|---|---|---|---|
| 2025 | $4,414 | $583,000 | $582,800 | $200 |
| 2024 | $4,414 | $583,000 | $582,800 | $200 |
| 2023 | $4,414 | $583,000 | $582,800 | $200 |
| 2022 | $7,100 | $735,800 | $459,400 | $276,400 |
| 2021 | $7,100 | $735,800 | $459,400 | $276,400 |
| 2020 | $7,100 | $735,800 | $459,400 | $276,400 |
| 2019 | $7,100 | $735,800 | $459,400 | $276,400 |
| 2018 | $5,576 | $425,000 | $218,900 | $206,100 |
| 2017 | $5,501 | $425,000 | $218,900 | $206,100 |
| 2016 | $5,501 | $425,000 | $218,900 | $206,100 |
| 2015 | $5,501 | $425,000 | $218,900 | $206,100 |
| 2014 | $5,317 | $401,100 | $218,900 | $182,200 |
Source: Public Records
Map
Nearby Homes
- 429 Dare Dr
- 2539 Anna Garrison Rd
- 529 Donatello Ave Unit 529
- 521 Donatello Ave Unit 521
- 3630 N Davidson St Unit 4407
- 3630 N Davidson St
- 3629 Warp St Unit 3629
- 3631 Warp St Unit 3631
- 3623 Card St Unit 3623
- 3519 Card St
- 3959 Picasso Ct Unit 3959
- 3254 Noda Blvd
- 3463 Steel Yard Ct
- 840 Academy St Unit 14
- 4021 Redwood Ave
- 453 Spearfield Ln
- 3451 Spencer St
- 4111 Rutgers Ave
- 3123 N Davidson St Unit 313
- 3123 N Davidson St Unit 301
- 3922 N Tryon St
- 3934 N Tryon St
- 4000 N Tryon St
- 307 Hunslet Cir
- 4112 N Tryon St
- 311 Hunslet Cir
- 3800 N Tryon St
- 315 Hunslet Cir
- 244 Hunslet Cir
- 308 Hunslet Cir
- 240 Hunslet Cir
- 319 Hunslet Cir
- 236 Hunslet Cir
- 232 Hunslet Cir
- 228 Hunslet Cir
- 224 Hunslet Cir
- 3902 Damask Dr
- 325 Hunslet Cir
- 3906 Damask Dr
- 220 Hunslet Cir