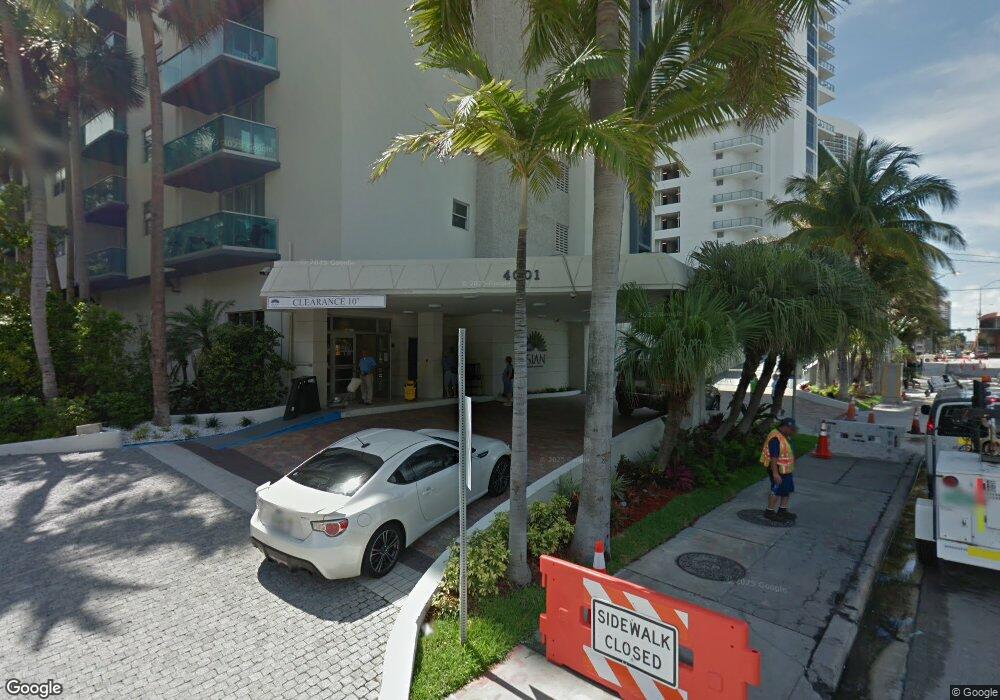
Sian Ocean Residences 4001 S Ocean Dr Unit 117A Hollywood, FL 33019
Central Beach NeighborhoodEstimated Value: $440,623 - $728,000
2
Beds
2
Baths
1,210
Sq Ft
$457/Sq Ft
Est. Value
About This Home
This home is located at 4001 S Ocean Dr Unit 117A, Hollywood, FL 33019 and is currently estimated at $552,906, approximately $456 per square foot. 4001 S Ocean Dr Unit 117A is a home located in Broward County with nearby schools including Hollywood Central Elementary School, Olsen Middle School, and Hallandale High School.
Ownership History
Date
Name
Owned For
Owner Type
Purchase Details
Closed on
Mar 10, 2017
Sold by
Oceanside Group Properties Inc
Bought by
Tan Adam and Tan Wendy
Current Estimated Value
Purchase Details
Closed on
Dec 19, 2014
Sold by
Sian 7 A Properties Llc
Bought by
Oceanside Group Properties Inc
Purchase Details
Closed on
Dec 5, 2011
Sold by
Blaksley Enrique
Bought by
Sian 7 A Properties Llc
Purchase Details
Closed on
May 4, 2010
Sold by
Alcorta Ignacio M
Bought by
Blaksley Enrique
Purchase Details
Closed on
Feb 20, 2007
Sold by
Mcz/Centrum Florida Xviii Llc
Bought by
Alcorta Ignacio M
Home Financials for this Owner
Home Financials are based on the most recent Mortgage that was taken out on this home.
Original Mortgage
$368,700
Interest Rate
9.39%
Mortgage Type
Negative Amortization
Create a Home Valuation Report for This Property
The Home Valuation Report is an in-depth analysis detailing your home's value as well as a comparison with similar homes in the area
Home Values in the Area
Average Home Value in this Area
Purchase History
| Date | Buyer | Sale Price | Title Company |
|---|---|---|---|
| Tan Adam | $325,000 | Attorney | |
| Oceanside Group Properties Inc | $260,000 | Attorney | |
| Sian 7 A Properties Llc | -- | Attorney | |
| Blaksley Enrique | $140,000 | Ad Valorem Title Llc | |
| Alcorta Ignacio M | $460,900 | Attorney |
Source: Public Records
Mortgage History
| Date | Status | Borrower | Loan Amount |
|---|---|---|---|
| Previous Owner | Alcorta Ignacio M | $368,700 |
Source: Public Records
Tax History Compared to Growth
Tax History
| Year | Tax Paid | Tax Assessment Tax Assessment Total Assessment is a certain percentage of the fair market value that is determined by local assessors to be the total taxable value of land and additions on the property. | Land | Improvement |
|---|---|---|---|---|
| 2025 | $9,466 | $449,780 | $44,980 | $404,800 |
| 2024 | $9,135 | $449,780 | $44,980 | $404,800 |
| 2023 | $9,135 | $389,040 | $0 | $0 |
| 2022 | $7,818 | $353,680 | $0 | $0 |
| 2021 | $7,040 | $321,530 | $32,150 | $289,380 |
| 2020 | $7,372 | $336,810 | $33,680 | $303,130 |
| 2019 | $7,432 | $347,910 | $34,790 | $313,120 |
| 2018 | $6,510 | $299,000 | $29,900 | $269,100 |
| 2017 | $6,679 | $286,280 | $0 | $0 |
| 2016 | $6,103 | $260,260 | $0 | $0 |
| 2015 | $5,409 | $236,600 | $0 | $0 |
| 2014 | $4,865 | $197,010 | $0 | $0 |
| 2013 | -- | $191,060 | $19,110 | $171,950 |
Source: Public Records
About Sian Ocean Residences
Map
Nearby Homes
- 4001 S Ocean Dr Unit 9L
- 4001 S Ocean Dr Unit 12L
- 4001 S Ocean Dr Unit 10B
- 4001 S Ocean Dr Unit 8E
- 4001 S Ocean Dr Unit 10G
- 4001 S Ocean Dr Unit 3H
- 4001 S Ocean Dr Unit 10K
- 4001 S Ocean Dr Unit 4G
- 4001 S Ocean Dr Unit 3P
- 4001 S Ocean Dr Unit 5K
- 4001 S Ocean Dr Unit 12N
- 4001 S Ocean Dr Unit 14G
- 4001 S Ocean Dr Unit 12K
- 4001 S Ocean Dr Unit 5M
- 4001 S Ocean Dr Unit 2C
- 4001 S Ocean Dr Unit 11A
- 4001 S Ocean Dr Unit 14H
- 4001 S Ocean Dr Unit 9F
- 4001 S Ocean Dr Unit 4E
- 4001 S Ocean Dr Unit 9N
- 4001 S Ocean Dr Unit 12C SEASONAL
- 4001 S Ocean Dr Unit 118L
- 4001 S Ocean Dr Unit 112J
- 4001 S Ocean Dr Unit 1114H
- 4001 S Ocean Dr Unit J
- 4001 S Ocean Dr Unit PH02
- 4001 S Ocean Dr Unit PH01
- 4001 S Ocean Dr Unit N
- 4001 S Ocean Dr
- 4001 S Ocean Dr
- 4001 S Ocean Dr
- 4001 S Ocean Dr
- 4001 S Ocean Dr Unit 15H SE
- 4001 S Ocean Dr Unit 12C SE
- 4001 S Ocean Dr Unit 1112G
- 4001 S Ocean Dr Unit 114F
- 4001 S Ocean Dr Unit 1112F
- 4001 S Ocean Dr Unit 119F
- 4001 S Ocean Dr Unit 114J
- 4001 S Ocean Dr Unit 116G