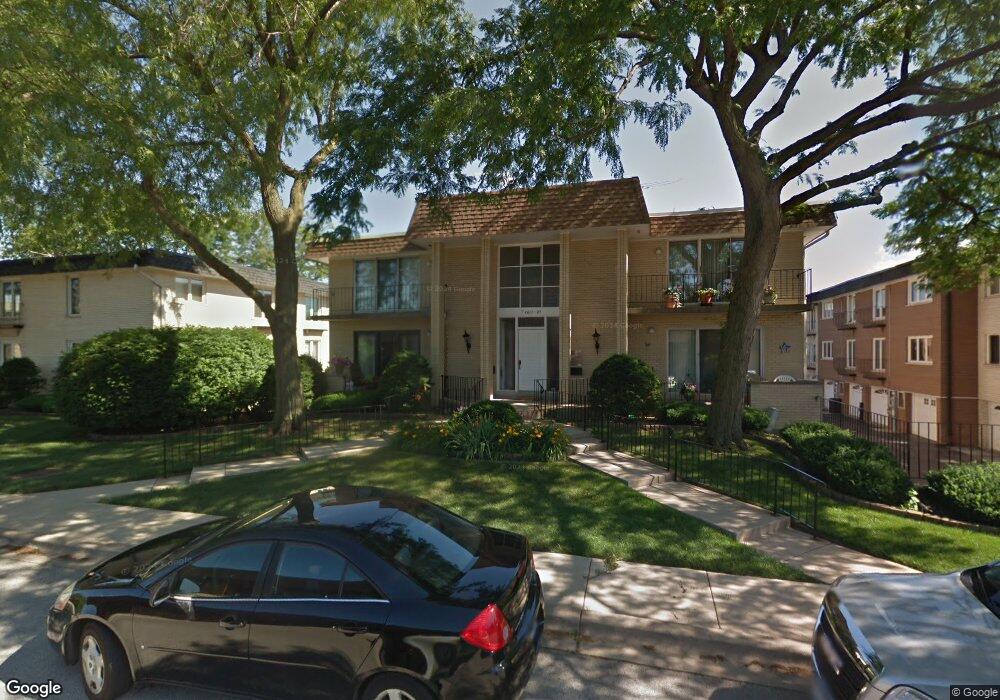
4001 W 104th St Oak Lawn, IL 60453
Estimated Value: $176,000 - $210,000
2
Beds
2
Baths
1,000
Sq Ft
$191/Sq Ft
Est. Value
About This Home
This home is located at 4001 W 104th St, Oak Lawn, IL 60453 and is currently estimated at $190,872, approximately $190 per square foot. 4001 W 104th St is a home located in Cook County with nearby schools including Kolmar Avenue Elementary School, Sward Elementary School, and Hometown Elementary School.
Ownership History
Date
Name
Owned For
Owner Type
Purchase Details
Closed on
Jul 18, 2018
Sold by
Cherullo Ernest and Rohde Cherullo Melissa
Bought by
Williams Scott
Current Estimated Value
Home Financials for this Owner
Home Financials are based on the most recent Mortgage that was taken out on this home.
Original Mortgage
$72,000
Outstanding Balance
$62,217
Interest Rate
4.37%
Mortgage Type
New Conventional
Estimated Equity
$128,655
Purchase Details
Closed on
Jan 28, 2005
Sold by
Furlong Thomas and Furlong Nancy
Bought by
Cherullo Ernest
Home Financials for this Owner
Home Financials are based on the most recent Mortgage that was taken out on this home.
Original Mortgage
$139,500
Interest Rate
5.79%
Mortgage Type
Purchase Money Mortgage
Purchase Details
Closed on
Jul 16, 2004
Sold by
Suburban Bank & Trust Co
Bought by
Furlong Thomas and Furlong Nancy
Create a Home Valuation Report for This Property
The Home Valuation Report is an in-depth analysis detailing your home's value as well as a comparison with similar homes in the area
Home Values in the Area
Average Home Value in this Area
Purchase History
| Date | Buyer | Sale Price | Title Company |
|---|---|---|---|
| Williams Scott | $80,000 | Prairie Title | |
| Cherullo Ernest | $155,000 | Cti | |
| Furlong Thomas | $107,000 | Cti |
Source: Public Records
Mortgage History
| Date | Status | Borrower | Loan Amount |
|---|---|---|---|
| Open | Williams Scott | $72,000 | |
| Previous Owner | Cherullo Ernest | $139,500 |
Source: Public Records
Tax History Compared to Growth
Tax History
| Year | Tax Paid | Tax Assessment Tax Assessment Total Assessment is a certain percentage of the fair market value that is determined by local assessors to be the total taxable value of land and additions on the property. | Land | Improvement |
|---|---|---|---|---|
| 2024 | $3,530 | $14,301 | $1,014 | $13,287 |
| 2023 | $2,506 | $14,301 | $1,014 | $13,287 |
| 2022 | $2,506 | $9,779 | $1,376 | $8,403 |
| 2021 | $2,474 | $9,778 | $1,376 | $8,402 |
| 2020 | $2,536 | $9,778 | $1,376 | $8,402 |
| 2019 | $1,716 | $7,905 | $1,267 | $6,638 |
| 2018 | $1,650 | $7,905 | $1,267 | $6,638 |
| 2017 | $1,693 | $7,905 | $1,267 | $6,638 |
| 2016 | $2,675 | $9,337 | $1,050 | $8,287 |
| 2015 | $2,588 | $9,337 | $1,050 | $8,287 |
| 2014 | $2,571 | $9,337 | $1,050 | $8,287 |
| 2013 | $2,313 | $9,375 | $1,050 | $8,325 |
Source: Public Records
Map
Nearby Homes
- 3955 W 104th St Unit 2B
- 10418 S Pulaski Rd Unit 204C
- 10448 S Pulaski Rd
- 3909 W 104th St
- 10314 S Komensky Ave Unit 3C
- 10509 Kedvale Ave
- 10511 S Hamlin Ave
- 3723 W 104th St
- 4000 W 107th St
- 10126 S Pulaski Rd Unit P4
- 10207 S Keeler Ave
- 10606 S Ridgeway Ave
- 10100 S Pulaski Rd Unit 1E
- 10528 S Lawndale Ave
- 3818 W 107th St
- 10420 S Kildare Ave
- 10048 S Pulaski Rd Unit 2B
- 10728 S Pulaski Rd
- 3625 W 104th St
- 3857 W 107th Place
- 4001 W 104th St Unit 201A
- 4001 W 104th St Unit 101A
- 4001 W 104th St Unit 2
- 4003 W 104th St Unit 102A
- 4003 W 104th St Unit 202A
- 10400 S Pulaski Rd Unit 104
- 10400 S Pulaski Rd Unit 204
- 10402 S Pulaski Rd Unit 103
- 10402 S Pulaski Rd Unit 203
- 10404 S Pulaski Rd Unit 102
- 10404 S Pulaski Rd Unit 202
- 10404 S Pulaski Rd Unit 1A
- 10406 S Pulaski Rd Unit 201
- 10406 S Pulaski Rd Unit 101
- 10405 S Komensky Ave Unit 104B
- 10405 S Komensky Ave Unit 204B
- 10405 S Komensky Ave Unit 2
- 10403 S Komensky Ave Unit 205B
- 10403 S Komensky Ave Unit 105B
- 10407 S Komensky Ave Unit 103B