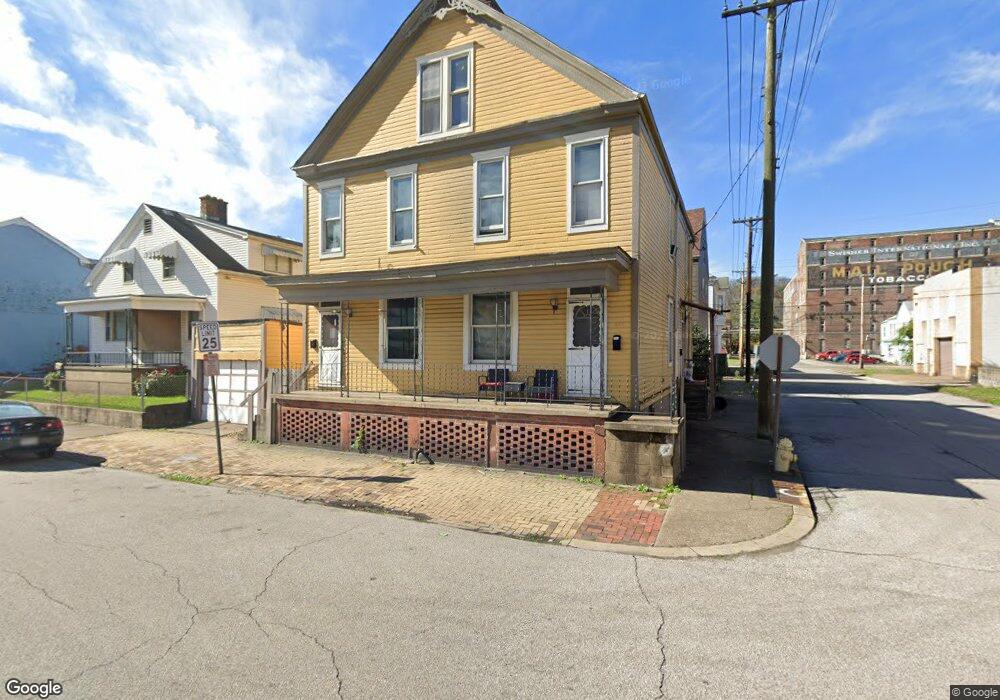
4001 Wood St Unit 4003 1/2 Wheeling, WV 26003
South Wheeling NeighborhoodEstimated Value: $133,000 - $196,000
4
Beds
4
Baths
3,344
Sq Ft
$51/Sq Ft
Est. Value
About This Home
This home is located at 4001 Wood St Unit 4003 1/2, Wheeling, WV 26003 and is currently estimated at $170,472, approximately $50 per square foot. 4001 Wood St Unit 4003 1/2 is a home located in Ohio County with nearby schools including Wheeling Park High School, Wheeling Catholic Elementary School, and Sts. James & John School.
Ownership History
Date
Name
Owned For
Owner Type
Purchase Details
Closed on
Nov 30, 2022
Sold by
Mcr Estates Llc
Bought by
New Perspective Management Llc
Current Estimated Value
Home Financials for this Owner
Home Financials are based on the most recent Mortgage that was taken out on this home.
Original Mortgage
$128,000
Outstanding Balance
$123,998
Interest Rate
7.08%
Mortgage Type
New Conventional
Estimated Equity
$46,474
Purchase Details
Closed on
Aug 19, 2022
Sold by
Mich-Cow Llc
Bought by
Mcr Estates Llc
Purchase Details
Closed on
Apr 2, 2020
Sold by
D & L Rental Properties Llc
Bought by
Mich Cow Llc
Purchase Details
Closed on
Nov 14, 2017
Sold by
B P & S Investors Llc
Bought by
D & L Rental Properties Llc
Create a Home Valuation Report for This Property
The Home Valuation Report is an in-depth analysis detailing your home's value as well as a comparison with similar homes in the area
Home Values in the Area
Average Home Value in this Area
Purchase History
| Date | Buyer | Sale Price | Title Company |
|---|---|---|---|
| New Perspective Management Llc | $160,000 | -- | |
| Mcr Estates Llc | $95,000 | Phillips Gardill Kaiser & Altm | |
| Mich Cow Llc | $85,000 | None Available | |
| D & L Rental Properties Llc | $73,000 | None Available |
Source: Public Records
Mortgage History
| Date | Status | Borrower | Loan Amount |
|---|---|---|---|
| Open | New Perspective Management Llc | $128,000 |
Source: Public Records
Tax History Compared to Growth
Tax History
| Year | Tax Paid | Tax Assessment Tax Assessment Total Assessment is a certain percentage of the fair market value that is determined by local assessors to be the total taxable value of land and additions on the property. | Land | Improvement |
|---|---|---|---|---|
| 2025 | $1,529 | $51,300 | $4,020 | $47,280 |
| 2024 | $1,529 | $49,200 | $4,020 | $45,180 |
| 2023 | $1,457 | $49,200 | $4,020 | $45,180 |
| 2022 | $1,473 | $49,200 | $4,020 | $45,180 |
| 2021 | $1,441 | $48,120 | $4,020 | $44,100 |
| 2020 | $1,437 | $48,120 | $4,020 | $44,100 |
| 2019 | $1,434 | $47,460 | $4,020 | $43,440 |
| 2018 | $1,317 | $46,440 | $4,020 | $42,420 |
| 2017 | $1,345 | $46,500 | $5,580 | $40,920 |
| 2016 | $1,286 | $44,580 | $5,760 | $38,820 |
| 2015 | -- | $42,840 | $4,500 | $38,340 |
| 2014 | -- | $41,940 | $4,260 | $37,680 |
Source: Public Records
Map
Nearby Homes