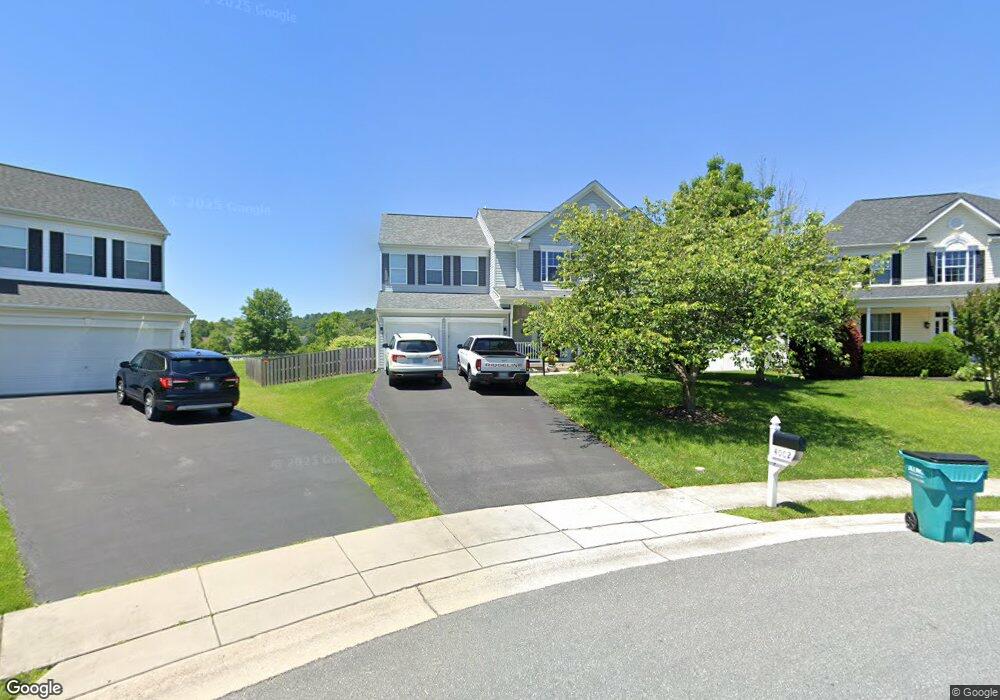
4002 Paw Paw Cir Point of Rocks, MD 21777
Estimated Value: $578,000 - $623,000
4
Beds
3
Baths
2,545
Sq Ft
$235/Sq Ft
Est. Value
About This Home
This home is located at 4002 Paw Paw Cir, Point of Rocks, MD 21777 and is currently estimated at $597,199, approximately $234 per square foot. 4002 Paw Paw Cir is a home located in Frederick County with nearby schools including Valley Elementary School, Brunswick Middle School, and Brunswick High School.
Ownership History
Date
Name
Owned For
Owner Type
Purchase Details
Closed on
Jan 23, 2024
Sold by
Sanders Julie Ann
Bought by
Martinez Joel Eliseo Rodri and Aviles Erika Elizabeth
Current Estimated Value
Home Financials for this Owner
Home Financials are based on the most recent Mortgage that was taken out on this home.
Original Mortgage
$444,000
Outstanding Balance
$435,733
Interest Rate
6.62%
Mortgage Type
New Conventional
Estimated Equity
$161,466
Purchase Details
Closed on
Aug 20, 2022
Sold by
Ann Sanders Julie
Bought by
Sanders Julie Ann
Purchase Details
Closed on
Sep 18, 2009
Sold by
Pv I Llc
Bought by
Sanders Philip Reisman and Sanders Julie Ann
Create a Home Valuation Report for This Property
The Home Valuation Report is an in-depth analysis detailing your home's value as well as a comparison with similar homes in the area
Home Values in the Area
Average Home Value in this Area
Purchase History
| Date | Buyer | Sale Price | Title Company |
|---|---|---|---|
| Martinez Joel Eliseo Rodri | $555,000 | Chicago Title | |
| Martinez Joel Eliseo Rodri | $555,000 | Chicago Title | |
| Sanders Julie Ann | -- | None Listed On Document | |
| Sanders Philip Reisman | $359,200 | -- |
Source: Public Records
Mortgage History
| Date | Status | Borrower | Loan Amount |
|---|---|---|---|
| Open | Martinez Joel Eliseo Rodri | $444,000 | |
| Closed | Martinez Joel Eliseo Rodri | $444,000 | |
| Closed | Sanders Philip Reisman | -- |
Source: Public Records
Tax History Compared to Growth
Tax History
| Year | Tax Paid | Tax Assessment Tax Assessment Total Assessment is a certain percentage of the fair market value that is determined by local assessors to be the total taxable value of land and additions on the property. | Land | Improvement |
|---|---|---|---|---|
| 2025 | $5,065 | $457,333 | -- | -- |
| 2024 | $5,065 | $411,000 | $99,000 | $312,000 |
| 2023 | $4,636 | $391,233 | $0 | $0 |
| 2022 | $4,379 | $371,467 | $0 | $0 |
| 2021 | $4,167 | $351,700 | $99,000 | $252,700 |
| 2020 | $4,167 | $351,200 | $0 | $0 |
| 2019 | $4,161 | $350,700 | $0 | $0 |
| 2018 | $4,192 | $350,200 | $99,000 | $251,200 |
| 2017 | $4,061 | $350,200 | $0 | $0 |
| 2016 | $4,105 | $334,000 | $0 | $0 |
| 2015 | $4,105 | $325,900 | $0 | $0 |
| 2014 | $4,105 | $325,900 | $0 | $0 |
Source: Public Records
Map
Nearby Homes
- 1734 Fletchers Dr
- 2731 Tuscarora Rd
- 2734 Tuscarora Rd
- 2915 Fry Rd
- 42024 Brightwood Ln
- 41272 Yakey Ln
- 43084 Little Angel Ct
- 43080 Little Angel Ct
- 3230 Basford Rd
- 0 Mary Ln Unit VALO2078558
- 12235 Mary Ln
- 1261 New Design Rd
- 5510 Doubs Rd
- 41073 Hickory Shade Ln
- 2705 Bill Dorsey Blvd
- 2727 Bill Dorsey Blvd
- 00000 Mae Wade Ave
- 5504 Young Family Trail E
- 0000 Modly Ct
- 00000 Modly Ct
- 4002 Paw Cir
- 4004 Paw Cir
- 4004 Paw Paw Cir
- 4000 Paw Cir
- 4000 Paw Paw Cir
- 4003 Lock Tender Ct
- 4001 Paw Paw Cir
- 1616 Fletchers Way
- 4001 Paw Cir
- 4003 Paw Cir
- 4003 Paw Paw Cir
- 4001 Lock Tender Ct
- 1618 Fletchers Way
- 4005 Lock Tender Ct
- 4005 Paw Cir
- 4005 Paw Paw Cir
- 4000 Lock Tender Ct
- 1697 Conrads Ferry Dr
- 1612 Fletchers Way
- 1699 Conrads Ferry Dr