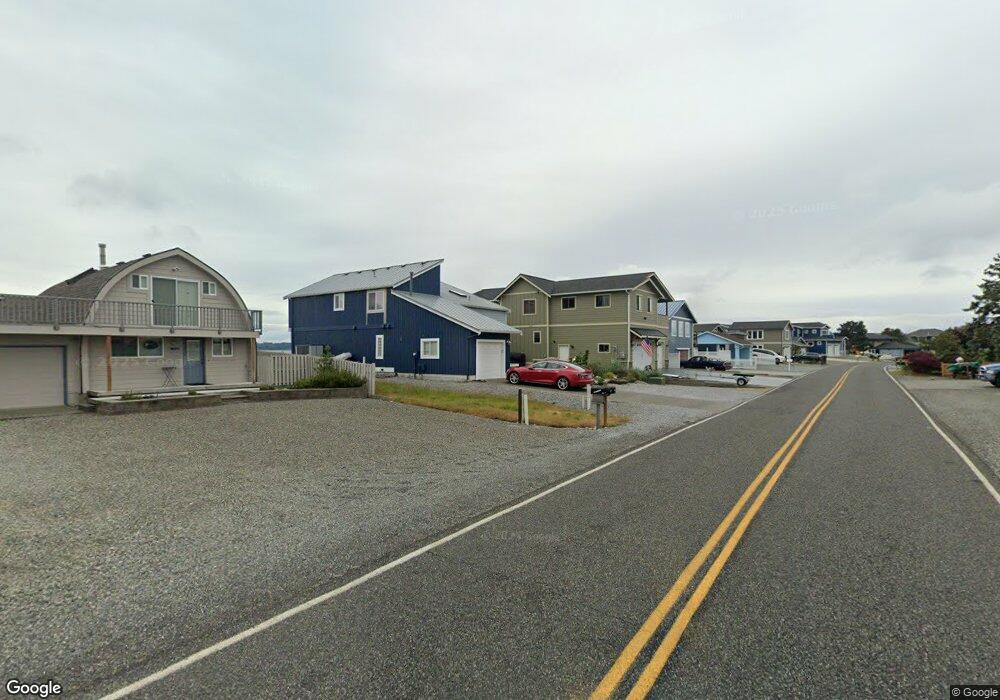
4002 Salt Spring Dr Ferndale, WA 98248
Estimated Value: $1,003,438 - $1,102,000
3
Beds
3
Baths
2,000
Sq Ft
$530/Sq Ft
Est. Value
About This Home
This home is located at 4002 Salt Spring Dr, Ferndale, WA 98248 and is currently estimated at $1,060,110, approximately $530 per square foot. 4002 Salt Spring Dr is a home located in Whatcom County with nearby schools including Eagleridge Elementary School, Horizon Middle School, and Ferndale High School.
Ownership History
Date
Name
Owned For
Owner Type
Purchase Details
Closed on
Sep 13, 2021
Sold by
Tharp Barry and Curre Anita G
Bought by
Fassett Sara
Current Estimated Value
Purchase Details
Closed on
May 25, 2016
Sold by
Brand Kurt and Tharp Barry
Bought by
Tharp Barry and Brand Kurt
Home Financials for this Owner
Home Financials are based on the most recent Mortgage that was taken out on this home.
Original Mortgage
$412,500
Interest Rate
3.58%
Mortgage Type
New Conventional
Purchase Details
Closed on
Jun 25, 2009
Sold by
Tharp Barry S and Brand Kurt E
Bought by
Tharp Barry and Brand Kurt
Home Financials for this Owner
Home Financials are based on the most recent Mortgage that was taken out on this home.
Original Mortgage
$402,400
Interest Rate
4.83%
Mortgage Type
Purchase Money Mortgage
Purchase Details
Closed on
Sep 24, 2001
Sold by
Holliday Duane H and Holliday Virginia A
Bought by
Curre Edwin J and Curre Anita G
Home Financials for this Owner
Home Financials are based on the most recent Mortgage that was taken out on this home.
Original Mortgage
$249,600
Interest Rate
6.91%
Create a Home Valuation Report for This Property
The Home Valuation Report is an in-depth analysis detailing your home's value as well as a comparison with similar homes in the area
Home Values in the Area
Average Home Value in this Area
Purchase History
| Date | Buyer | Sale Price | Title Company |
|---|---|---|---|
| Fassett Sara | $1,000,000 | Guardian Nw Title | |
| Tharp Barry | -- | First American Title | |
| Tharp Barry | -- | Chicago Title Insurance | |
| Curre Edwin J | $268,179 | First American Title Insuran |
Source: Public Records
Mortgage History
| Date | Status | Borrower | Loan Amount |
|---|---|---|---|
| Previous Owner | Tharp Barry | $412,500 | |
| Previous Owner | Tharp Barry | $402,400 | |
| Previous Owner | Curre Edwin J | $249,600 |
Source: Public Records
Tax History Compared to Growth
Tax History
| Year | Tax Paid | Tax Assessment Tax Assessment Total Assessment is a certain percentage of the fair market value that is determined by local assessors to be the total taxable value of land and additions on the property. | Land | Improvement |
|---|---|---|---|---|
| 2024 | $6,113 | $830,771 | $339,144 | $491,627 |
| 2023 | $6,113 | $867,277 | $354,042 | $513,235 |
| 2022 | $5,267 | $719,725 | $293,800 | $425,925 |
| 2021 | $5,518 | $584,935 | $260,000 | $324,935 |
| 2020 | $5,870 | $555,824 | $257,205 | $298,619 |
| 2019 | $4,513 | $535,175 | $247,650 | $287,525 |
| 2018 | $5,596 | $463,538 | $214,500 | $249,038 |
| 2017 | $5,182 | $440,845 | $203,580 | $237,265 |
| 2016 | $5,037 | $431,411 | $198,900 | $232,511 |
| 2015 | $4,824 | $421,398 | $195,000 | $226,398 |
| 2014 | -- | $406,319 | $189,000 | $217,319 |
| 2013 | -- | $406,319 | $189,000 | $217,319 |
Source: Public Records
Map
Nearby Homes
- 3913 Saltspring Dr
- 3909 Saltspring Dr
- 3910 Saltspring Dr
- 3906 Saltspring Dr
- 3905 Saltspring Dr
- 3902 Saltspring Dr
- 3895 Saltspring Dr
- 4126 Matia Dr
- 4144 Saltspring Dr
- 4072 Sucia Dr
- 4149 Saltspring Dr
- 4448 Saltspring Dr
- 4273 Saltspring Dr
- 4309 Saltspring Dr
- 4383 Sucia Dr
- 4418 Sucia Dr
- 4421 Sucia Dr
- 4440 Sucia Dr
- 3758 Sinclair Dr
- 4482 Moresby Way
- 4002 Saltspring Dr
- 3998 Saltspring Dr
- 4006 Salt Spring Dr
- 3994 Salt Spring Dr
- 4010 Salt Spring Dr
- 3990 Salt Spring Dr
- 4014 Salt Spring Dr
- 4025 Saltspring Dr
- 4017 Saltspring Dr
- 4033 Salt Spring Dr
- 4033 Saltspring Dr
- 4018 Salt Spring Dr
- 4009 Saltspring Dr
- 3982 Salt Spring Dr
- 4013 Saltspring Dr
- 4037 Saltspring Dr
- 4022 Salt Spring Dr
- 4022 Saltspring Dr
- 3978 Salt Spring Dr