4002 Sumner Rd Moultrie, GA 31768
Estimated Value: $222,000 - $1,889,732
Studio
4
Baths
1,096
Sq Ft
$963/Sq Ft
Est. Value
About This Home
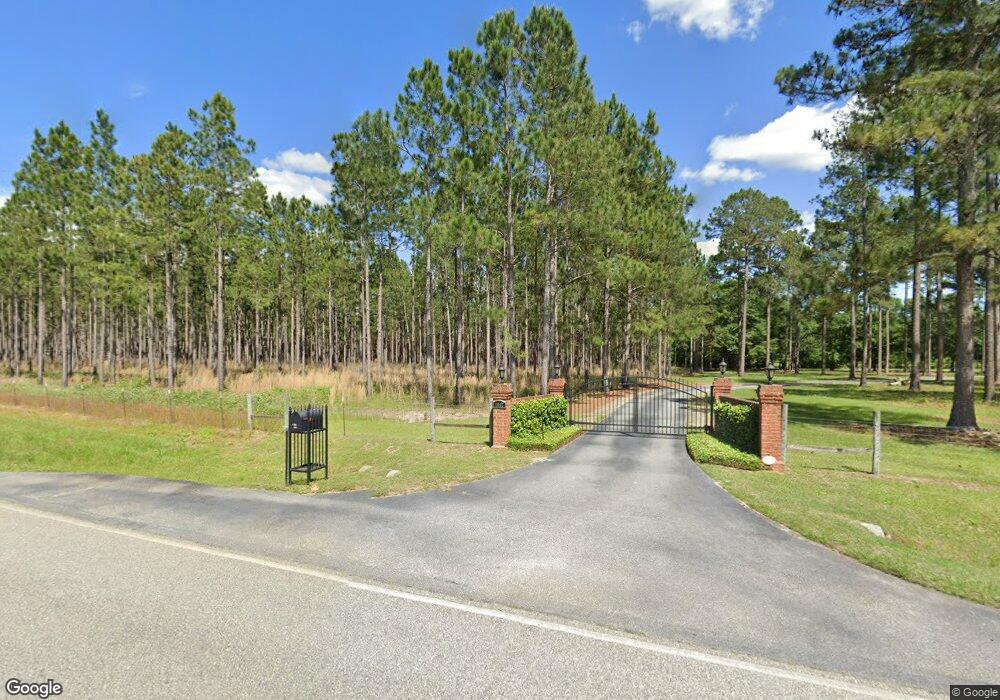
This home is located at 4002 Sumner Rd, Moultrie, GA 31768 and is currently estimated at $1,055,866, approximately $963 per square foot. 4002 Sumner Rd is a home located in Colquitt County with nearby schools including Okapilco Elementary School, C.A. Gray Junior High School, and Willie J. Williams Middle School.
Ownership History
Date
Name
Owned For
Owner Type
Purchase Details
Closed on
Feb 14, 2008
Sold by
Ward James H
Bought by
Ward Catherine W
Current Estimated Value
Purchase Details
Closed on
Dec 28, 2000
Sold by
Wincey Kenneth W
Bought by
Ward James H
Purchase Details
Closed on
Apr 5, 1999
Bought by
Wincey Kenneth W
Purchase Details
Closed on
Feb 23, 1998
Bought by
Mcintosh George C
Purchase Details
Closed on
Dec 20, 1997
Bought by
Weyerhaeuser Real Estate
Purchase Details
Closed on
Nov 20, 1997
Bought by
Weyerhaeuser Real Estate
Create a Home Valuation Report for This Property
The Home Valuation Report is an in-depth analysis detailing your home's value as well as a comparison with similar homes in the area
Purchase History
| Date | Buyer | Sale Price | Title Company |
|---|---|---|---|
| Ward Catherine W | -- | -- | |
| Ward James H | $550,000 | -- | |
| Wincey Kenneth W | $360,000 | -- | |
| Mcintosh George C | $300,000 | -- | |
| Weyerhaeuser Real Estate | -- | -- | |
| Weyerhaeuser Real Estate | -- | -- |
Source: Public Records
Tax History
| Year | Tax Paid | Tax Assessment Tax Assessment Total Assessment is a certain percentage of the fair market value that is determined by local assessors to be the total taxable value of land and additions on the property. | Land | Improvement |
|---|---|---|---|---|
| 2025 | $9,738 | $655,930 | $202,778 | $453,152 |
| 2024 | $9,738 | $568,827 | $193,514 | $375,313 |
| 2023 | $11,680 | $569,137 | $193,514 | $375,623 |
| 2022 | $9,570 | $528,864 | $192,180 | $336,684 |
| 2021 | $8,780 | $469,023 | $170,954 | $298,069 |
| 2020 | $8,354 | $447,122 | $170,954 | $276,168 |
| 2019 | $8,847 | $432,522 | $170,954 | $261,568 |
| 2018 | $11,063 | $432,522 | $170,954 | $261,568 |
| 2017 | $9,730 | $457,034 | $149,544 | $307,490 |
| 2016 | $9,818 | $457,034 | $149,544 | $307,490 |
| 2015 | $9,869 | $457,035 | $149,544 | $307,490 |
| 2014 | $9,645 | $457,035 | $149,544 | $307,490 |
| 2013 | -- | $457,034 | $149,544 | $307,490 |
Source: Public Records
Map
Nearby Homes
- 441 Weaver Rd
- 4263 Doerun Norman Park Rd
- 2537 Sumner Rd
- 1852 Doerun Norman Park Rd
- 485 Davis Rd
- 173 Middlebrooks St
- 512 Hagin Still Rd
- 672 Cherokee Dr
- 210 Arrowhead Dr
- 183 Short St
- 000 U S Highway 319
- 5213 US Hwy 319 N
- 514 Indian Lake Dr
- 000 Star Cir
- 131 Seminole Dr
- 209 Cherokee Dr
- 291 Seminole Dr
- 0 Mark Orton Ln
- 159 Golden Rd
- Sardis Schley Church Rd
Your Personal Tour Guide
Ask me questions while you tour the home.