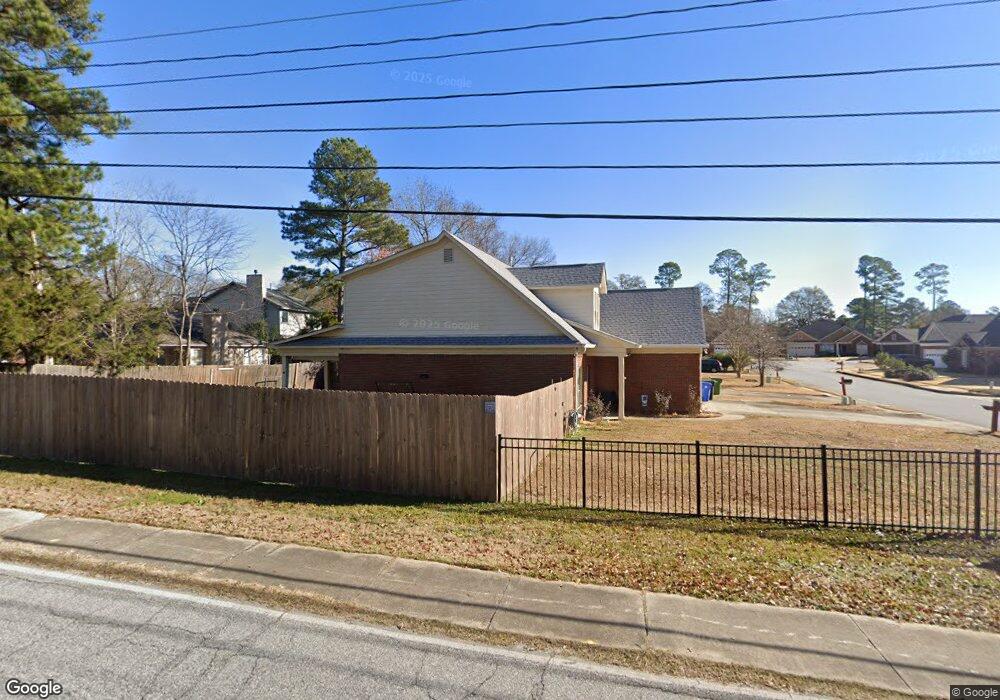
4003 Foster Ln Columbus, GA 31907
Eastern Columbus NeighborhoodEstimated Value: $254,350 - $311,000
4
Beds
3
Baths
2,021
Sq Ft
$140/Sq Ft
Est. Value
About This Home
This home is located at 4003 Foster Ln, Columbus, GA 31907 and is currently estimated at $283,838, approximately $140 per square foot. 4003 Foster Ln is a home located in Muscogee County with nearby schools including Gentian Elementary School, Fort Middle School, and Hardaway High School.
Ownership History
Date
Name
Owned For
Owner Type
Purchase Details
Closed on
Apr 8, 2020
Sold by
Premo John
Bought by
Marple Charles W and Marple Kathryn D
Current Estimated Value
Home Financials for this Owner
Home Financials are based on the most recent Mortgage that was taken out on this home.
Original Mortgage
$89,900
Outstanding Balance
$79,489
Interest Rate
3.3%
Mortgage Type
New Conventional
Estimated Equity
$204,349
Purchase Details
Closed on
Feb 21, 2018
Sold by
Dong Xiu Yue
Bought by
John Premo and Premo Mariah
Home Financials for this Owner
Home Financials are based on the most recent Mortgage that was taken out on this home.
Original Mortgage
$196,126
Interest Rate
4.15%
Mortgage Type
VA
Purchase Details
Closed on
Jul 15, 2009
Sold by
Cronen Christopher M and Cronen Araceli
Bought by
Dong Xiu Yue
Home Financials for this Owner
Home Financials are based on the most recent Mortgage that was taken out on this home.
Original Mortgage
$140,000
Interest Rate
5.37%
Mortgage Type
Purchase Money Mortgage
Create a Home Valuation Report for This Property
The Home Valuation Report is an in-depth analysis detailing your home's value as well as a comparison with similar homes in the area
Home Values in the Area
Average Home Value in this Area
Purchase History
| Date | Buyer | Sale Price | Title Company |
|---|---|---|---|
| Marple Charles W | $189,900 | -- | |
| John Premo | $192,000 | -- | |
| Dong Xiu Yue | $200,000 | None Available |
Source: Public Records
Mortgage History
| Date | Status | Borrower | Loan Amount |
|---|---|---|---|
| Open | Marple Charles W | $89,900 | |
| Previous Owner | John Premo | $196,126 | |
| Previous Owner | Dong Xiu Yue | $140,000 |
Source: Public Records
Tax History Compared to Growth
Tax History
| Year | Tax Paid | Tax Assessment Tax Assessment Total Assessment is a certain percentage of the fair market value that is determined by local assessors to be the total taxable value of land and additions on the property. | Land | Improvement |
|---|---|---|---|---|
| 2025 | $2,132 | $87,060 | $8,788 | $78,272 |
| 2024 | $2,132 | $87,060 | $8,788 | $78,272 |
| 2023 | $871 | $87,060 | $8,788 | $78,272 |
| 2022 | $2,224 | $74,552 | $8,788 | $65,764 |
| 2021 | $2,224 | $75,960 | $8,320 | $67,640 |
| 2020 | $2,808 | $68,748 | $8,788 | $59,960 |
| 2019 | $2,817 | $68,748 | $8,788 | $59,960 |
| 2018 | $2,898 | $68,748 | $8,788 | $59,960 |
| 2017 | $2,909 | $68,748 | $8,788 | $59,960 |
| 2016 | $2,921 | $84,077 | $17,200 | $66,877 |
| 2015 | $2,925 | $84,077 | $17,200 | $66,877 |
| 2014 | $2,929 | $84,077 | $17,200 | $66,877 |
| 2013 | -- | $84,077 | $17,200 | $66,877 |
Source: Public Records
Map
Nearby Homes
- 4419 Anglin Rd
- 3816 Anglin Rd
- 3935 Tifton Dr
- 4047 Sealy Ln
- 4004 Tifton Dr
- 4110 Norwood Dr
- 4520 Marci Ct
- 3716 University Ave
- 4017 River Rock Way
- 4133 Pickering Dr
- 3834 Rockdale Dr
- 3409 Primrose Rd
- 3504 Vernon Dr
- 3409 Hiawatha Dr
- 3872 E Britt David Rd
- 3425 Tomahawk Dr
- 3935 Dexter Dr
- 10 Conisburgh Ct
- 4807 Fairview Dr
- 4709 Rowland Ave