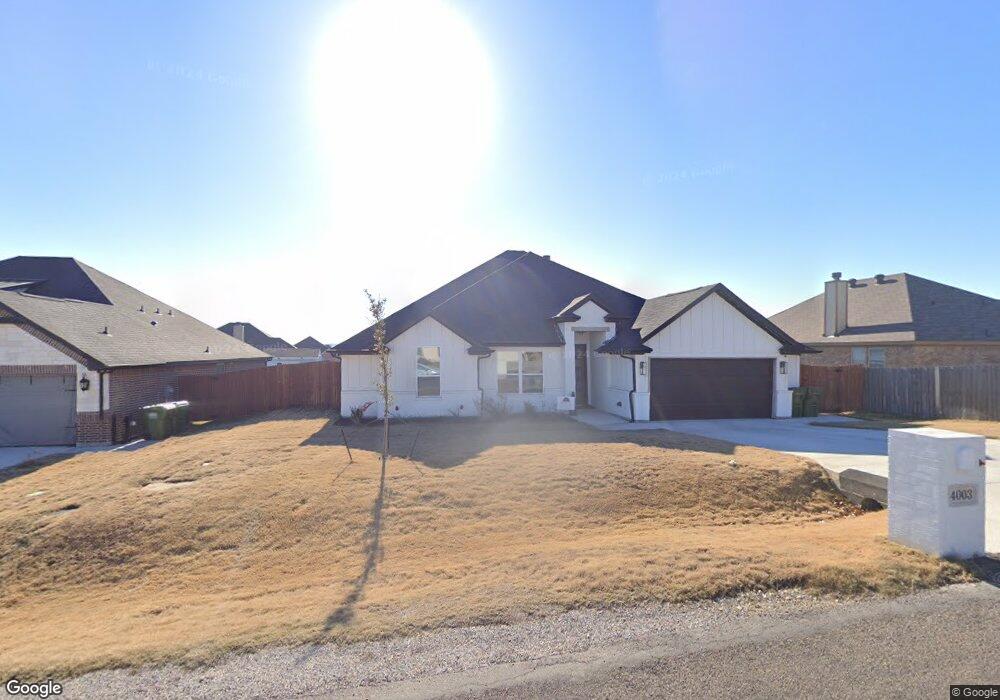
4003 Gallivant Dr Granbury, TX 76049
Estimated Value: $359,218 - $403,000
--
Bed
--
Bath
2,134
Sq Ft
$182/Sq Ft
Est. Value
About This Home
This home is located at 4003 Gallivant Dr, Granbury, TX 76049 and is currently estimated at $388,555, approximately $182 per square foot. 4003 Gallivant Dr is a home with nearby schools including Oak Woods School, Acton Middle School, and Granbury High School.
Ownership History
Date
Name
Owned For
Owner Type
Purchase Details
Closed on
Oct 28, 2022
Sold by
Premier Homes
Bought by
Spivey Alan Gregory and Spivey Carrie
Current Estimated Value
Home Financials for this Owner
Home Financials are based on the most recent Mortgage that was taken out on this home.
Original Mortgage
$287,900
Outstanding Balance
$277,006
Interest Rate
6.02%
Mortgage Type
New Conventional
Estimated Equity
$111,549
Purchase Details
Closed on
Jan 6, 2022
Sold by
Tri-County Development Inc
Bought by
Premier Homes
Home Financials for this Owner
Home Financials are based on the most recent Mortgage that was taken out on this home.
Original Mortgage
$301,000
Interest Rate
3.11%
Mortgage Type
Commercial
Purchase Details
Closed on
Feb 27, 2009
Sold by
Tri County Development
Bought by
Tri County Development
Create a Home Valuation Report for This Property
The Home Valuation Report is an in-depth analysis detailing your home's value as well as a comparison with similar homes in the area
Home Values in the Area
Average Home Value in this Area
Purchase History
| Date | Buyer | Sale Price | Title Company |
|---|---|---|---|
| Spivey Alan Gregory | -- | Capital Title | |
| Premier Homes | -- | Capital Title | |
| Tri County Development | -- | -- |
Source: Public Records
Mortgage History
| Date | Status | Borrower | Loan Amount |
|---|---|---|---|
| Open | Spivey Alan Gregory | $287,900 | |
| Previous Owner | Premier Homes | $301,000 |
Source: Public Records
Tax History Compared to Growth
Tax History
| Year | Tax Paid | Tax Assessment Tax Assessment Total Assessment is a certain percentage of the fair market value that is determined by local assessors to be the total taxable value of land and additions on the property. | Land | Improvement |
|---|---|---|---|---|
| 2025 | $4,775 | $398,220 | $30,000 | $368,220 |
| 2024 | $4,723 | $388,170 | $30,000 | $358,170 |
| 2023 | $4,927 | $404,910 | $30,000 | $374,910 |
| 2022 | $166 | $12,500 | $12,500 | $0 |
| 2021 | $192 | $12,500 | $12,500 | $0 |
| 2020 | $136 | $8,750 | $8,750 | $0 |
| 2019 | $142 | $8,750 | $8,750 | $0 |
| 2018 | $81 | $5,000 | $5,000 | $0 |
| 2017 | $67 | $4,000 | $4,000 | $0 |
| 2016 | $67 | $4,000 | $4,000 | $0 |
| 2015 | $66 | $4,000 | $4,000 | $0 |
| 2014 | $66 | $4,000 | $4,000 | $0 |
Source: Public Records
Map
Nearby Homes
- 3004 Saunter Ln
- 4017 Gallivant Dr
- 3004 Stroll Dr
- 3306 Promenade Ct
- 815 Wandering Ct
- 3018 Stroll Dr
- 2924 Meandering Way
- 1000 Meander Rd
- 1007 Bentwater Pkwy
- 2305 Wills Way Dr
- 2300 E Emerald Bend Ct
- 2207 Wood Duck Ln
- 3121 N Fork Ct
- 2508 Wills Way Dr
- 2101 W Emerald Bend Ct
- 1400 Bentwater Pkwy
- 2116 Darby Dan Ct
- 2113 Darby Dan Ct
- 2104 Wills Way Dr
- 2701 Wills Way Dr
- 4005 Gallivant Dr
- 910 Winding Rd
- 3002 Promenade Dr
- 4007 Gallivant Dr
- 908 Winding Rd
- 914 Winding Rd
- 3006 Promenade Dr
- 4002 Gallivant Dr
- 4004 Gallivant Dr
- 2704 Drift Ct
- 4009 Gallivant Dr
- 3008 Promenade Dr
- 3003 Promenade Dr
- 4010 Gallivant Dr
- 915 Winding Rd
- 5003 Wearing Way Dr
- 3005 Promenade Dr
- 916 Winding Rd
- 5005 Wearing Way Dr
- 4011 Gallivant Dr