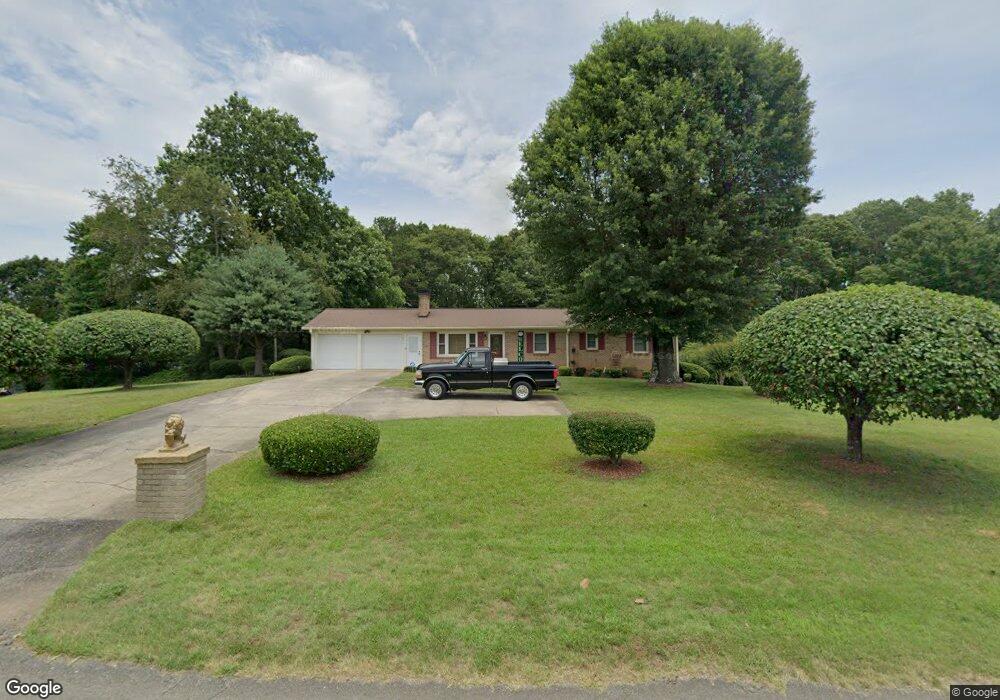
4003 Hillview Cir Shelby, NC 28152
Estimated Value: $164,000 - $261,000
--
Bed
--
Bath
1,676
Sq Ft
$133/Sq Ft
Est. Value
About This Home
This home is located at 4003 Hillview Cir, Shelby, NC 28152 and is currently estimated at $223,349, approximately $133 per square foot. 4003 Hillview Cir is a home located in Cleveland County with nearby schools including Marion Intermediate School, Shelby Middle School, and Shelby High School.
Create a Home Valuation Report for This Property
The Home Valuation Report is an in-depth analysis detailing your home's value as well as a comparison with similar homes in the area
Home Values in the Area
Average Home Value in this Area
Tax History Compared to Growth
Tax History
| Year | Tax Paid | Tax Assessment Tax Assessment Total Assessment is a certain percentage of the fair market value that is determined by local assessors to be the total taxable value of land and additions on the property. | Land | Improvement |
|---|---|---|---|---|
| 2025 | $1,094 | $172,316 | $12,210 | $160,106 |
| 2024 | $993 | $114,784 | $9,990 | $104,794 |
| 2023 | $991 | $114,784 | $9,990 | $104,794 |
| 2022 | $988 | $114,784 | $9,990 | $104,794 |
| 2021 | $991 | $114,784 | $9,990 | $104,794 |
| 2020 | $851 | $93,892 | $9,990 | $83,902 |
| 2019 | $851 | $93,892 | $9,990 | $83,902 |
| 2018 | $846 | $93,892 | $9,990 | $83,902 |
| 2017 | $842 | $93,892 | $9,990 | $83,902 |
| 2016 | $804 | $93,892 | $9,990 | $83,902 |
| 2015 | $838 | $98,182 | $9,990 | $88,192 |
| 2014 | $838 | $98,182 | $9,990 | $88,192 |
Source: Public Records
Map
Nearby Homes
- 00 Pinecrest Dr
- 123 Pinecrest Dr
- 122 Pinecrest Dr
- 0 Pinecrest Dr
- 135 Shadowgate Dr
- 124 Tanya Ln
- 114 Tanya Ln
- 329 Aniston Ln
- 1900 E Dixon Blvd
- 2338 Hoey Church Rd
- 2344 Joes Lake Rd
- 4022 Lynn Cir
- The Jackson Plan at Kings View
- The Linfield - II Plan at Kings View
- The Weston Plan at Kings View
- The Jacobs Plan at Kings View
- 217 Lake George Dr
- 236 Pinnacle Crossing
- 506 Maddox Dr
- 2126 Amesbury Dr
- 4005 Hillview Cir
- 4004 Hillview Cir
- 4007 Hillview Cir
- 4008 Hillview Dr
- 4006 Hillview Cir
- 4002 Hillview Cir
- 4008 Hillview Cir
- 4009 Hillview Cir
- 4000 Hillview Cir
- 4007 Hillview Dr Unit 1
- 4007 Hillview Dr
- 2511 Taylor Rd
- 2505 Taylor Rd
- 4003 Hillview Dr
- 2503 Taylor Rd
- 2501 Taylor Rd
- 2517 Taylor Rd
- 2519 Taylor Rd
- 2523 Taylor Rd
- 515 Caleb Rd