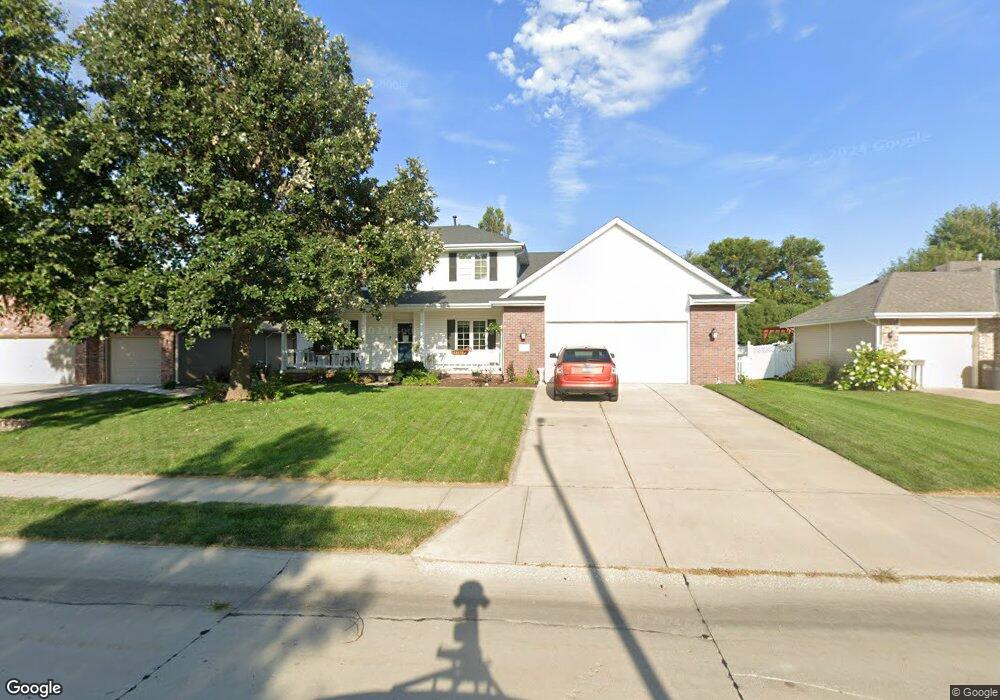
4003 N 209th St Elkhorn, NE 68022
Estimated Value: $454,995 - $517,000
4
Beds
4
Baths
3,093
Sq Ft
$156/Sq Ft
Est. Value
About This Home
This home is located at 4003 N 209th St, Elkhorn, NE 68022 and is currently estimated at $481,499, approximately $155 per square foot. 4003 N 209th St is a home located in Douglas County with nearby schools including Arbor View Elementary School, Elkhorn Middle School, and Elkhorn High School.
Ownership History
Date
Name
Owned For
Owner Type
Purchase Details
Closed on
Sep 21, 2010
Sold by
Burney Charles J and Burney Kathy J
Bought by
Beavers Jerry L and Beavers Deborah F
Current Estimated Value
Home Financials for this Owner
Home Financials are based on the most recent Mortgage that was taken out on this home.
Original Mortgage
$184,800
Interest Rate
4.46%
Mortgage Type
New Conventional
Purchase Details
Closed on
Aug 9, 2001
Sold by
Greg Paasch Construction Inc
Bought by
Burney Charles J and Burney Kathy J
Home Financials for this Owner
Home Financials are based on the most recent Mortgage that was taken out on this home.
Original Mortgage
$179,629
Interest Rate
7.14%
Create a Home Valuation Report for This Property
The Home Valuation Report is an in-depth analysis detailing your home's value as well as a comparison with similar homes in the area
Home Values in the Area
Average Home Value in this Area
Purchase History
| Date | Buyer | Sale Price | Title Company |
|---|---|---|---|
| Beavers Jerry L | $231,000 | Spence Title Services | |
| Burney Charles J | $200,000 | -- |
Source: Public Records
Mortgage History
| Date | Status | Borrower | Loan Amount |
|---|---|---|---|
| Closed | Beavers Jerry L | $184,800 | |
| Closed | Burney Charles J | $179,629 |
Source: Public Records
Tax History Compared to Growth
Tax History
| Year | Tax Paid | Tax Assessment Tax Assessment Total Assessment is a certain percentage of the fair market value that is determined by local assessors to be the total taxable value of land and additions on the property. | Land | Improvement |
|---|---|---|---|---|
| 2025 | $6,809 | $436,300 | $39,400 | $396,900 |
| 2024 | $9,173 | $436,300 | $39,400 | $396,900 |
| 2023 | $9,173 | $436,300 | $39,400 | $396,900 |
| 2022 | $7,848 | $343,200 | $39,400 | $303,800 |
| 2021 | $7,899 | $343,200 | $39,400 | $303,800 |
| 2020 | $7,973 | $343,200 | $39,400 | $303,800 |
| 2019 | $6,692 | $289,000 | $39,400 | $249,600 |
| 2018 | $6,633 | $289,000 | $39,400 | $249,600 |
| 2017 | $6,541 | $289,000 | $39,400 | $249,600 |
| 2016 | $6,169 | $274,100 | $24,600 | $249,500 |
| 2015 | $5,723 | $256,200 | $23,000 | $233,200 |
| 2014 | $5,723 | $256,200 | $23,000 | $233,200 |
Source: Public Records
Map
Nearby Homes
- 6316 N 208th St
- 6328 N 208th St
- 6327 N 208th St Unit Lot 59
- 6203 N 208th St Unit Lot 51
- 21319 Boyd St
- 21205 Boyd St
- 21413 Boyd St
- 21221 Boyd St
- 21315 Boyd St
- 3903 N 212th St
- 21317 Taylor Cir
- 21412 Taylor Cir
- 21308 Sunburst Ave
- 21303 Sunburst Ave
- 20506 Taylor St
- 4613 N 208th St
- 21335 Taylor Cir
- 21330 Taylor Cir
- 21404 Taylor Cir
- 21408 Taylor Cir
- 4009 N 209th St
- 3923 N 209th St
- 4004 N 208th St
- 3922 N 208th St
- 4010 N 208th St
- 3922 208
- 3917 N 209th St
- 4008 N 209th St
- 20815 Sequoia St
- 3928 N 209th St
- 20809 Sequoia St
- 3916 N 208th St
- 4014 N 209th St
- 3922 N 209th St
- 3911 N 209th St
- 20803 Sequoia St
- 4020 N 209th St
- 3910 N 208th St
- 3968 S 208th St
- 3916 209