4003 S Brentwood Ln Coeur D'Alene, ID 83814
Estimated Value: $1,428,000 - $1,696,000
3
Beds
4
Baths
3,758
Sq Ft
$423/Sq Ft
Est. Value
About This Home
This home is located at 4003 S Brentwood Ln, Coeur D'Alene, ID 83814 and is currently estimated at $1,587,874, approximately $422 per square foot. 4003 S Brentwood Ln is a home located in Kootenai County with nearby schools including Winton Elementary School, Lakes Magnet Middle School, and Lake City High School.
Ownership History
Date
Name
Owned For
Owner Type
Purchase Details
Closed on
Dec 22, 2016
Sold by
Hamann Rene
Bought by
Hamann Rene
Current Estimated Value
Home Financials for this Owner
Home Financials are based on the most recent Mortgage that was taken out on this home.
Original Mortgage
$250,000
Outstanding Balance
$164,133
Interest Rate
3.94%
Mortgage Type
New Conventional
Estimated Equity
$1,423,741
Purchase Details
Closed on
Jan 18, 2012
Sold by
Beaver Thomas A and Beaver Pamela J
Bought by
Hamann Rene and Hamann Cheryl A
Purchase Details
Closed on
Jan 9, 2008
Sold by
Felker David A and Felker Emma M A
Bought by
Beaver Thomas A and Beaver Pamela J
Home Financials for this Owner
Home Financials are based on the most recent Mortgage that was taken out on this home.
Original Mortgage
$550,000
Interest Rate
5.96%
Mortgage Type
Purchase Money Mortgage
Create a Home Valuation Report for This Property
The Home Valuation Report is an in-depth analysis detailing your home's value as well as a comparison with similar homes in the area
Home Values in the Area
Average Home Value in this Area
Purchase History
| Date | Buyer | Sale Price | Title Company |
|---|---|---|---|
| Hamann Rene | -- | Pioneer Title Kootenai Count | |
| Hamann Rene | -- | Pioneer Title Co | |
| Beaver Thomas A | -- | -- |
Source: Public Records
Mortgage History
| Date | Status | Borrower | Loan Amount |
|---|---|---|---|
| Open | Hamann Rene | $250,000 | |
| Previous Owner | Beaver Thomas A | $550,000 |
Source: Public Records
Tax History Compared to Growth
Tax History
| Year | Tax Paid | Tax Assessment Tax Assessment Total Assessment is a certain percentage of the fair market value that is determined by local assessors to be the total taxable value of land and additions on the property. | Land | Improvement |
|---|---|---|---|---|
| 2025 | $4,361 | $1,186,926 | $270,000 | $916,926 |
| 2024 | $4,361 | $1,368,071 | $350,000 | $1,018,071 |
| 2023 | $4,361 | $1,368,071 | $350,000 | $1,018,071 |
| 2022 | $4,642 | $1,368,071 | $350,000 | $1,018,071 |
| 2021 | $4,346 | $828,470 | $187,000 | $641,470 |
| 2020 | $4,568 | $747,490 | $170,000 | $577,490 |
| 2019 | $4,613 | $706,550 | $160,000 | $546,550 |
| 2018 | $4,744 | $665,650 | $160,000 | $505,650 |
| 2017 | $4,865 | $644,730 | $160,000 | $484,730 |
| 2016 | $4,727 | $606,910 | $155,000 | $451,910 |
| 2015 | $2,166 | $548,020 | $120,000 | $428,020 |
| 2013 | $4,158 | $490,590 | $86,400 | $404,190 |
Source: Public Records
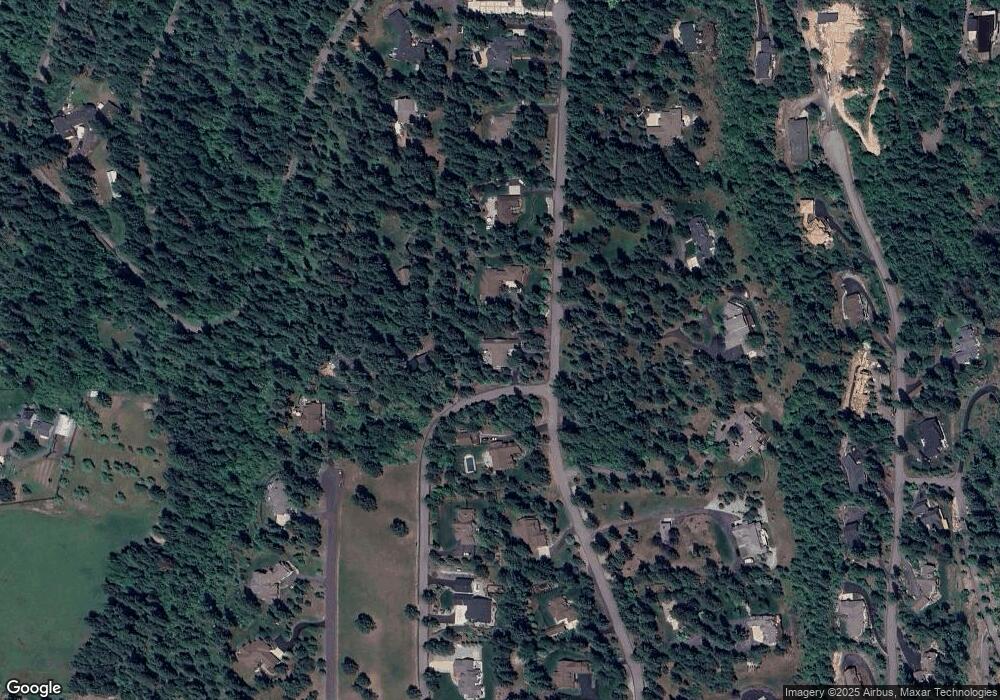
Map
Nearby Homes
- NKA S North Cape Rd
- 3676 S North Cape Rd
- Lt 1 Blk 1 S Isaac Stevens Rd
- 190 W Eagle Crest Dr
- 4175 S Boisen Loop
- 0 Threemile Point Road L5 B2 Unit 24-10695
- 4173 S Isaac Stevens Rd
- NNA S Greenfield Ln
- 4520 S Threemile Point Rd
- 0 Threemile Point Rd L3 B2
- 4926 S Scenic Dr
- 0 Scenic Drive L1 and L2 B3 Unit 24-7771
- 4987 S Bay Pointe Way
- 5003 S Bay Pointe Way
- NKA S Westway Dr
- 4549 S Arrow Point Dr Unit 303
- 4549 S Arrow Point Dr Unit 207
- 4669 S Arrow Point Dr Unit 210
- 4757 S Arrow Point Dr Unit 307
- 4757 S Arrow Point Dr Unit 305
- 4003 S Brentwood Ln
- 3959 S Brentwood Ln
- 4050 Meadow Lane Dr
- 4065 S Brentwood Ln
- 0 Brentwood Lt 5 Blk 2
- 0 Meadow Lane Dr Lt 29a Blk 1
- 0 Brentwood Lt 13 Blk 2
- 0 Meadow Lane Dr Lt 28a Blk 1
- 0 Harbor View Dr Lt 31 Blk 2
- 0 Harbor View Dr Lt 29 Blk 2
- 0 Brentwood Lt 9b Blk 2
- 0 Brentwood Lt 15 Blk 2
- 0 Harbor View Dr Lt 27 Blk 2
- 0 Harbor View Dr Lt 28 Blk 2
- 0 Brentwood Lt 11 Blk 2
- 0 Brentwood Lt 7 Blk 2
- 0 Cloudview Dr Lt 4 Blk 2
- 0 Harbor View Dr Lt 30 Blk 1
- 0 Meadow Lane Dr Lt 20 Blk 1
- 0 Meadow Lane Dr Lt 13 Blk 1