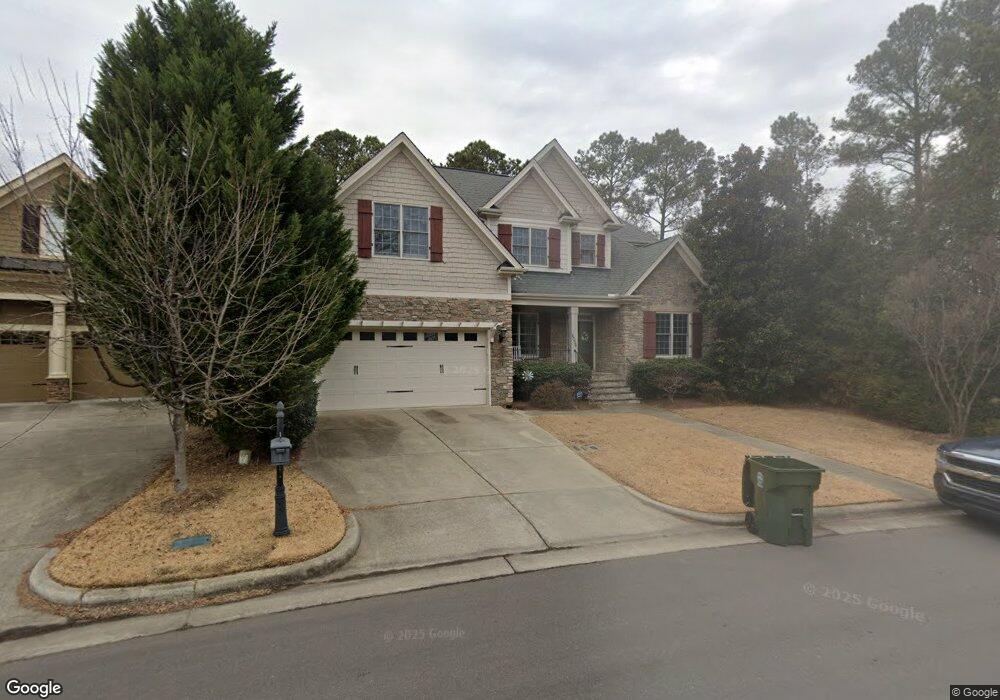
4004 Enfield Ridge Dr Unit L90 Cary, NC 27519
West Cary NeighborhoodEstimated Value: $904,000 - $985,000
5
Beds
4
Baths
3,315
Sq Ft
$286/Sq Ft
Est. Value
About This Home
This home is located at 4004 Enfield Ridge Dr Unit L90, Cary, NC 27519 and is currently estimated at $946,510, approximately $285 per square foot. 4004 Enfield Ridge Dr Unit L90 is a home located in Wake County with nearby schools including Highcroft Elementary, Mills Park Middle School, and Green Level High School.
Ownership History
Date
Name
Owned For
Owner Type
Purchase Details
Closed on
Oct 5, 2021
Sold by
Rosenoff Evan M and Rosenoff Mary Lou
Bought by
Bala Sandeep and Wu Mian
Current Estimated Value
Home Financials for this Owner
Home Financials are based on the most recent Mortgage that was taken out on this home.
Original Mortgage
$516,000
Outstanding Balance
$470,544
Interest Rate
2.8%
Mortgage Type
New Conventional
Estimated Equity
$475,966
Purchase Details
Closed on
Oct 30, 2008
Sold by
Reward Builders Inc
Bought by
Rosenoff Evan M and Rosenoff Mary Lou
Home Financials for this Owner
Home Financials are based on the most recent Mortgage that was taken out on this home.
Original Mortgage
$346,000
Interest Rate
5.78%
Mortgage Type
Purchase Money Mortgage
Create a Home Valuation Report for This Property
The Home Valuation Report is an in-depth analysis detailing your home's value as well as a comparison with similar homes in the area
Home Values in the Area
Average Home Value in this Area
Purchase History
| Date | Buyer | Sale Price | Title Company |
|---|---|---|---|
| Bala Sandeep | $738,000 | None Available | |
| Rosenoff Evan M | $432,500 | None Available |
Source: Public Records
Mortgage History
| Date | Status | Borrower | Loan Amount |
|---|---|---|---|
| Open | Bala Sandeep | $516,000 | |
| Previous Owner | Rosenoff Evan M | $346,000 | |
| Previous Owner | Rosenoff Evan M | $64,875 |
Source: Public Records
Tax History Compared to Growth
Tax History
| Year | Tax Paid | Tax Assessment Tax Assessment Total Assessment is a certain percentage of the fair market value that is determined by local assessors to be the total taxable value of land and additions on the property. | Land | Improvement |
|---|---|---|---|---|
| 2025 | $7,266 | $845,451 | $210,000 | $635,451 |
| 2024 | $7,109 | $845,451 | $210,000 | $635,451 |
| 2023 | $5,112 | $508,194 | $89,000 | $419,194 |
| 2022 | $4,922 | $508,194 | $89,000 | $419,194 |
| 2021 | $4,822 | $508,194 | $89,000 | $419,194 |
| 2020 | $3,343 | $508,194 | $89,000 | $419,194 |
| 2019 | $5,003 | $465,416 | $89,000 | $376,416 |
| 2018 | $4,695 | $465,416 | $89,000 | $376,416 |
| 2017 | $4,511 | $465,416 | $89,000 | $376,416 |
| 2016 | $4,444 | $465,416 | $89,000 | $376,416 |
| 2015 | $4,592 | $464,417 | $90,000 | $374,417 |
| 2014 | $4,330 | $464,417 | $90,000 | $374,417 |
Source: Public Records
Map
Nearby Homes
- 921 Lemster Ln
- 101 Crystal Brook Ln
- 101 Uplands Creek Dr
- 3002 Heritage Pines Dr
- 484 Autumn Rain St
- 3533 Sienna Hill Place
- 105 Rockport Ridge Way
- 204 Indian Elm Ln
- 210 Lindemans Dr
- 5001 Sears Farm Rd
- 5102 Highcroft Dr
- 5724 Hurkett Ct
- 400 Indian Elm Ln
- 408 Indian Elm Ln
- 102 W Hill Dr
- 617 Katy Stella Dr
- 400 Boscawen Ln
- 536 Rockcastle Dr
- 2552 Hayes Hill Place
- 108 Ferncroft Ct
- 4004 Enfield Ridge Dr
- 4008 Enfield Ridge Dr
- 4008 Enfield Ridge Dr Unit L50
- 4012 Enfield Ridge Dr
- 4013 Enfield Ridge Dr Unit L49
- 4013 Enfield Ridge Dr
- 4016 Enfield Ridge Dr
- 4016 Enfield Ridge Dr Unit L52
- 4017 Enfield Ridge Dr
- 4017 Enfield Ridge Dr Unit L48
- 4017 Enfield Dr
- 4024 Enfield Ridge Dr
- 4024 Enfield Ridge Dr Unit L53
- 4021 Enfield Ridge Dr
- 4025 Enfield Ridge Dr
- 4025 Enfield Ridge Dr Unit L46
- 4028 Enfield Ridge Dr
- 6017 Retford Grant Ct
- 4029 Enfield Ridge Dr
- 4029 Enfield Ridge Dr Unit L45