Estimated Value: $168,782 - $191,000
--
Bed
1
Bath
1,047
Sq Ft
$174/Sq Ft
Est. Value
About This Home
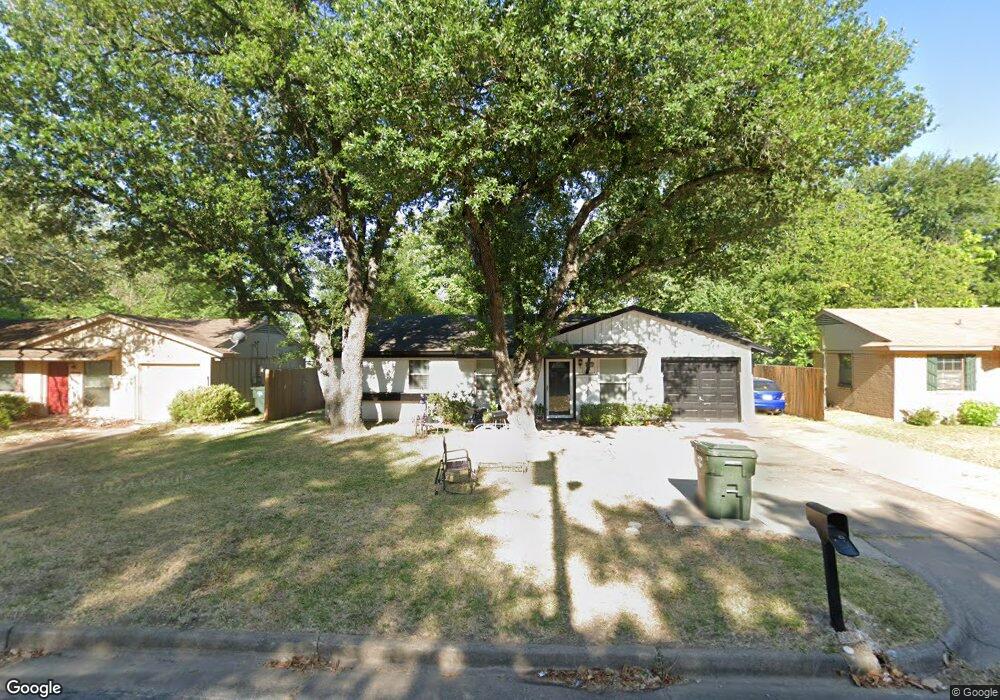
This home is located at 4005 Appletree Ln, Tyler, TX 75701 and is currently estimated at $182,696, approximately $174 per square foot. 4005 Appletree Ln is a home located in Smith County with nearby schools including Woods Elementary School, Hubbard Middle School, and Tyler Legacy High School.
Ownership History
Date
Name
Owned For
Owner Type
Purchase Details
Closed on
Aug 8, 2011
Sold by
Gladney Samuel
Bought by
Langhorne Properties Llc Series L
Current Estimated Value
Purchase Details
Closed on
Apr 30, 2009
Sold by
Double D Rentals
Bought by
Gladney Samuel
Home Financials for this Owner
Home Financials are based on the most recent Mortgage that was taken out on this home.
Original Mortgage
$81,043
Interest Rate
5.03%
Mortgage Type
FHA
Purchase Details
Closed on
Feb 1, 2005
Sold by
Bailey Harold L and Bailey Bonnie L
Bought by
Barker Oscar and Gardiner Catherine J
Home Financials for this Owner
Home Financials are based on the most recent Mortgage that was taken out on this home.
Original Mortgage
$58,208
Interest Rate
5.85%
Mortgage Type
Credit Line Revolving
Create a Home Valuation Report for This Property
The Home Valuation Report is an in-depth analysis detailing your home's value as well as a comparison with similar homes in the area
Home Values in the Area
Average Home Value in this Area
Purchase History
| Date | Buyer | Sale Price | Title Company |
|---|---|---|---|
| Langhorne Properties Llc Series L | -- | None Available | |
| Gladney Samuel | -- | None Available | |
| Barker Oscar | -- | None Available |
Source: Public Records
Mortgage History
| Date | Status | Borrower | Loan Amount |
|---|---|---|---|
| Previous Owner | Gladney Samuel | $81,043 | |
| Previous Owner | Barker Oscar | $58,208 | |
| Closed | Barker Oscar | $0 |
Source: Public Records
Tax History Compared to Growth
Tax History
| Year | Tax Paid | Tax Assessment Tax Assessment Total Assessment is a certain percentage of the fair market value that is determined by local assessors to be the total taxable value of land and additions on the property. | Land | Improvement |
|---|---|---|---|---|
| 2025 | $2,558 | $193,520 | $61,612 | $131,908 |
| 2024 | $2,558 | $150,389 | $22,869 | $127,520 |
| 2023 | $2,582 | $148,092 | $22,869 | $125,223 |
| 2022 | $2,615 | $133,487 | $22,869 | $110,618 |
| 2021 | $1,996 | $95,153 | $22,869 | $72,284 |
| 2020 | $1,992 | $93,107 | $17,459 | $75,648 |
| 2019 | $2,023 | $92,515 | $17,459 | $75,056 |
| 2018 | $1,766 | $81,177 | $10,270 | $70,907 |
| 2017 | $1,733 | $81,177 | $10,270 | $70,907 |
| 2016 | $1,635 | $76,570 | $10,270 | $66,300 |
| 2015 | $1,593 | $72,911 | $10,270 | $62,641 |
| 2014 | $1,593 | $74,944 | $10,270 | $64,674 |
Source: Public Records
Map
Nearby Homes
- 3903 Appletree Ln
- 4001 Darrell Ln
- 3915 Post Oak Rd
- 1317 Woodland Hills Dr
- 3829 Cloverdale Dr
- 1531 Woodland Hills Dr
- 3518 Cloverdale Dr
- 3505 Cloverdale Dr
- 815 Woodland Hills Dr
- 3606 Glendale Dr
- 3426 Bienville Dr
- 3425 Iberville Dr
- 3501 Silverwood Dr
- 3500 Silverwood Dr
- 3413 Iberville Dr
- 3404 Silverwood Dr
- 701 Woodland Hills Dr
- 612 Rosemont Place II
- 604-606 Woodland Hills Dr
- 1107 Larkspur Ln
- 4009 Appletree Ln
- 4001 Appletree Ln
- 4006 Driftwood Ln
- 3911 Appletree Ln
- 4013 Appletree Ln
- 4010 Driftwood Ln
- 4002 Driftwood Ln
- 4006 4006 Appletree
- 4002 Appletree Ln
- 4006 Appletree Ln
- 3912 Driftwood Ln
- 3907 Appletree Ln
- 4010 Appletree Ln
- 3912 Appletree Ln
- 4014 4014 Appletree
- 3908 Appletree Ln
- 3908 Driftwood Ln
- 4014 Appletree Ln
- 4102 Driftwood Ln
- 3903 3903 Appletree Ln