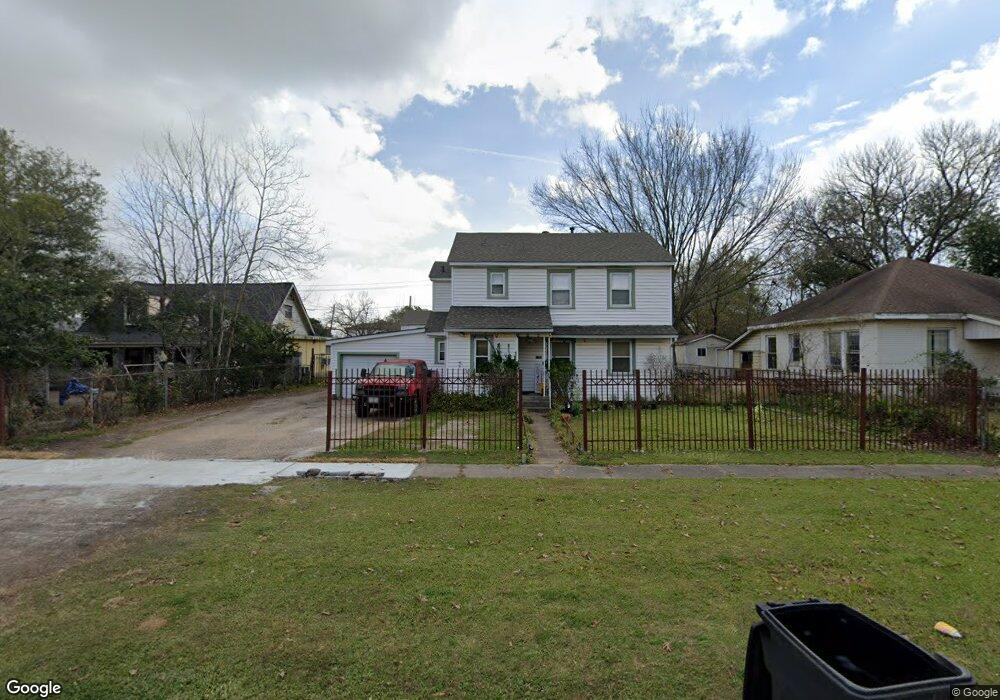
4005 Dover St Houston, TX 77087
Golfcrest-Bellfort-Reveille NeighborhoodEstimated Value: $241,000 - $323,000
5
Beds
3
Baths
2,598
Sq Ft
$110/Sq Ft
Est. Value
About This Home
This home is located at 4005 Dover St, Houston, TX 77087 and is currently estimated at $284,992, approximately $109 per square foot. 4005 Dover St is a home located in Harris County with nearby schools including Park Place Elementary School, Daniel Ortiz Middle School, and Chavez High School.
Ownership History
Date
Name
Owned For
Owner Type
Purchase Details
Closed on
May 10, 2023
Sold by
Giesen Barney W
Bought by
Alexs Home Investor Inc
Current Estimated Value
Purchase Details
Closed on
Apr 5, 2023
Sold by
Smith Ronald Lee
Bought by
Giesen Barney
Purchase Details
Closed on
Mar 17, 2021
Sold by
Salinas Edith Guadalupe and Chapa Arnulfo Gutierrez
Bought by
Roman Artemio and Roman Marina
Home Financials for this Owner
Home Financials are based on the most recent Mortgage that was taken out on this home.
Original Mortgage
$116,000
Interest Rate
2.7%
Mortgage Type
Purchase Money Mortgage
Purchase Details
Closed on
Jun 28, 2013
Sold by
Lambert Patricia Kay Furstenberg
Bought by
Roman Artemio and Roman Marina
Home Financials for this Owner
Home Financials are based on the most recent Mortgage that was taken out on this home.
Original Mortgage
$115,862
Interest Rate
4.25%
Mortgage Type
FHA
Create a Home Valuation Report for This Property
The Home Valuation Report is an in-depth analysis detailing your home's value as well as a comparison with similar homes in the area
Home Values in the Area
Average Home Value in this Area
Purchase History
| Date | Buyer | Sale Price | Title Company |
|---|---|---|---|
| Alexs Home Investor Inc | -- | Tradition Title Company | |
| Giesen Barney | -- | -- | |
| Roman Artemio | -- | None Available | |
| Roman Artemio | -- | Texas American Title Company |
Source: Public Records
Mortgage History
| Date | Status | Borrower | Loan Amount |
|---|---|---|---|
| Previous Owner | Roman Artemio | $116,000 | |
| Previous Owner | Roman Artemio | $115,862 |
Source: Public Records
Tax History Compared to Growth
Tax History
| Year | Tax Paid | Tax Assessment Tax Assessment Total Assessment is a certain percentage of the fair market value that is determined by local assessors to be the total taxable value of land and additions on the property. | Land | Improvement |
|---|---|---|---|---|
| 2025 | $160 | $243,597 | $64,500 | $179,097 |
| 2024 | $160 | $243,597 | $64,500 | $179,097 |
| 2023 | $160 | $241,204 | $64,500 | $176,704 |
| 2022 | $3,965 | $230,197 | $64,500 | $165,697 |
| 2021 | $3,815 | $219,673 | $45,150 | $174,523 |
| 2020 | $3,604 | $148,812 | $36,120 | $112,692 |
| 2019 | $3,670 | $145,014 | $36,120 | $108,894 |
| 2018 | $2,648 | $145,014 | $36,120 | $108,894 |
| 2017 | $3,667 | $145,014 | $36,120 | $108,894 |
| 2016 | $3,419 | $135,385 | $36,120 | $99,265 |
| 2015 | $2,362 | $122,935 | $36,120 | $86,815 |
| 2014 | $2,362 | $122,935 | $36,120 | $86,815 |
Source: Public Records
Map
Nearby Homes
- 0 Dover St Unit 39828065
- 7909 Dixie Dr
- 7758 Hereford St
- 3743 Erie St
- 7734 El Rancho St
- 8135 Glenbrook Dr
- 8124 Glenbrook Dr
- 3727 Broadway St
- 7735 Oak Vista St
- 7802 Santa Elena St
- 7846 Santa Elena St
- 3607 De Leon St
- 7936 Grove Ridge Dr
- 7908 Grove Ridge Dr
- 7954 Grove Ridge Dr
- 7837 Leonora St
- 7819 Leonora St
- 7937 Grafton St
- 3731 Reveille St
- 8250 Park Place Blvd Unit 303
- 4001 Dover St
- 4009 Dover St
- 4013 Dover St
- 0 Dover St Unit 61216805
- 0 Dover St Unit 596251
- 0 Dover St Unit 26134764
- 0 Dover St Unit 32786248
- 0 Dover St Unit 65734147
- 0 Dover St Unit 28518385
- 0 Dover St Unit 36400697
- 0 Dover St Unit 49242975
- 4008 Erie St
- 4016 Erie St
- 0 Erie St Unit 9011433
- 4004 Erie St
- 3923 Dover St
- 4017 Dover St
- 4022 Erie St
- 4008 Dover St
- 4016 Dover St