Estimated Value: $184,000 - $327,000
3
Beds
2
Baths
1,461
Sq Ft
$169/Sq Ft
Est. Value
About This Home
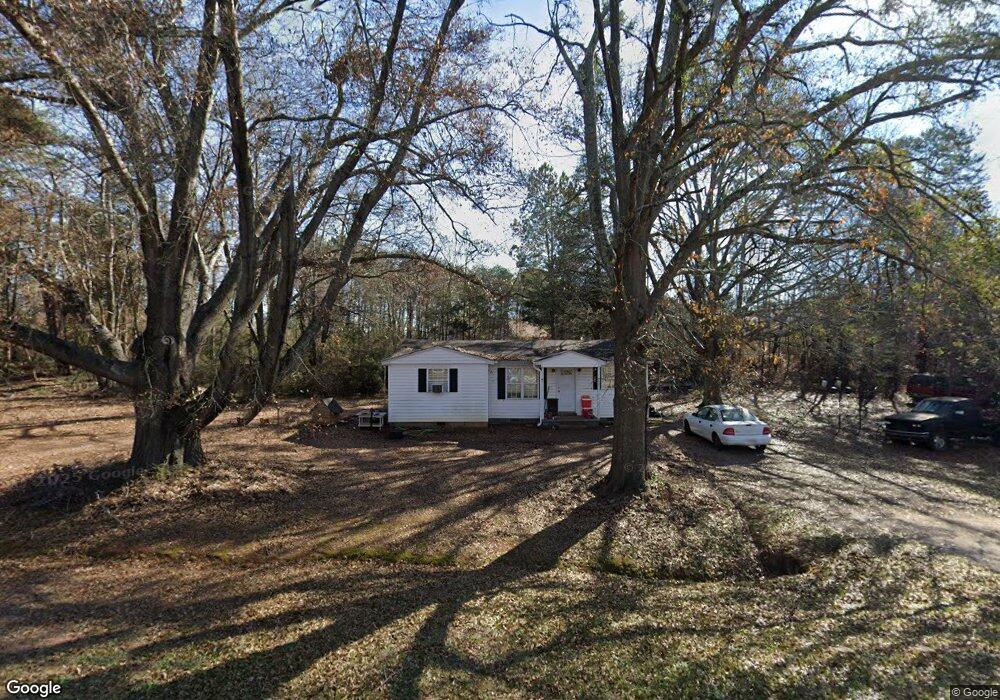
This home is located at 4005 Highway 11, Inman, SC 29349 and is currently estimated at $246,448, approximately $168 per square foot. 4005 Highway 11 is a home located in Spartanburg County with nearby schools including Cooley Springs-Fingerville Elementary School, Rainbow Lake Middle School, and Boiling Springs High School.
Ownership History
Date
Name
Owned For
Owner Type
Purchase Details
Closed on
Jun 29, 2020
Sold by
Biggs Anthony K
Bought by
Biggs Jessica M and Biggs Anthony K
Current Estimated Value
Purchase Details
Closed on
Oct 26, 2018
Sold by
Honest Home Sales Llc
Bought by
Biggs Anthony K
Home Financials for this Owner
Home Financials are based on the most recent Mortgage that was taken out on this home.
Original Mortgage
$126,161
Outstanding Balance
$110,486
Interest Rate
4.7%
Mortgage Type
New Conventional
Estimated Equity
$135,962
Purchase Details
Closed on
Apr 16, 2018
Sold by
Sanders Launeil and Sanders Janneth E
Bought by
Honest Home Sales Llc
Home Financials for this Owner
Home Financials are based on the most recent Mortgage that was taken out on this home.
Original Mortgage
$680,000
Interest Rate
4.44%
Mortgage Type
Purchase Money Mortgage
Create a Home Valuation Report for This Property
The Home Valuation Report is an in-depth analysis detailing your home's value as well as a comparison with similar homes in the area
Home Values in the Area
Average Home Value in this Area
Purchase History
| Date | Buyer | Sale Price | Title Company |
|---|---|---|---|
| Biggs Jessica M | -- | None Available | |
| Biggs Anthony K | $124,900 | None Available | |
| Honest Home Sales Llc | $70,000 | None Available |
Source: Public Records
Mortgage History
| Date | Status | Borrower | Loan Amount |
|---|---|---|---|
| Open | Biggs Anthony K | $126,161 | |
| Previous Owner | Honest Home Sales Llc | $680,000 |
Source: Public Records
Tax History Compared to Growth
Tax History
| Year | Tax Paid | Tax Assessment Tax Assessment Total Assessment is a certain percentage of the fair market value that is determined by local assessors to be the total taxable value of land and additions on the property. | Land | Improvement |
|---|---|---|---|---|
| 2025 | $953 | $5,745 | $1,017 | $4,728 |
| 2024 | $953 | $5,745 | $1,017 | $4,728 |
| 2023 | $953 | $5,745 | $1,017 | $4,728 |
| 2022 | $863 | $4,996 | $884 | $4,112 |
| 2021 | $863 | $4,996 | $884 | $4,112 |
| 2020 | $2,762 | $7,494 | $1,326 | $6,168 |
| 2019 | $846 | $4,386 | $776 | $3,610 |
| 2018 | $2,698 | $7,524 | $1,326 | $6,198 |
| 2017 | $2,076 | $5,710 | $742 | $4,968 |
| 2016 | $2,076 | $5,710 | $742 | $4,968 |
| 2015 | $2,071 | $5,710 | $742 | $4,968 |
| 2014 | $2,065 | $5,710 | $742 | $4,968 |
Source: Public Records
Map
Nearby Homes
- 372 Long Branch Rd
- 292 Long Branch Rd
- 209 Riverbluff Extension
- 896 Anderson Rd
- 152 Long Branch Rd
- 150 Jolley Rd
- 106 S 962
- 138 Lowe Rd
- 1457 Country Estates Rd
- 2650 Rainbow Lake Rd
- 571 Ray Blackley Rd
- 5223 S Carolina 11
- 0 Cooley Springs School Rd
- 158 Bradley Rd
- 410 Dodger Ave
- 406 Dodger Ave
- 415 Dodger Ave
- 4045 Highway 11
- 501 Long Branch Rd
- 4051 Highway 11
- 4005 Highway 11 W
- 3945 Highway 11
- 515 S 962
- 4014 Highway 11
- 508 S 962
- 4068 Highway 11
- 484 Long Branch Rd
- 519 S 962
- 3950 Highway 11
- 519 Long Branch Rd
- 3928 Highway 11
- 465 Long Branch Rd
- 3918 Highway 11 Unit 3922
- 143 Riverbluff Dr
- 145 Riverbluff Dr
- 117 Riverbluff Dr
- 470 Long Branch Rd