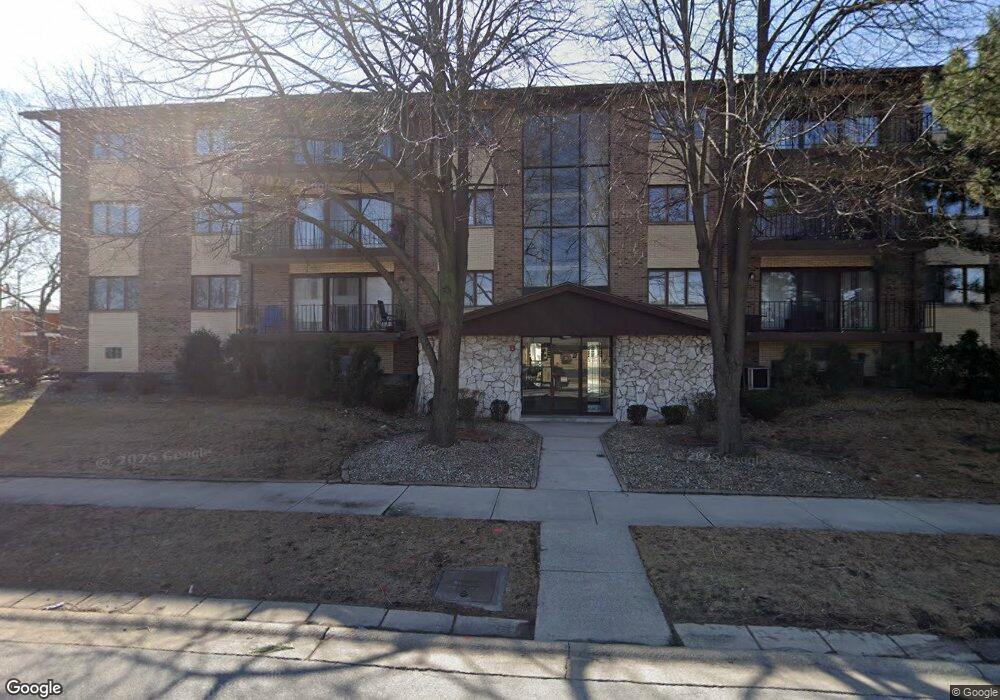
4005 W 93rd St Unit 4E Oak Lawn, IL 60453
Estimated Value: $251,000 - $277,000
3
Beds
2
Baths
1,700
Sq Ft
$153/Sq Ft
Est. Value
About This Home
This home is located at 4005 W 93rd St Unit 4E, Oak Lawn, IL 60453 and is currently estimated at $260,165, approximately $153 per square foot. 4005 W 93rd St Unit 4E is a home located in Cook County with nearby schools including Hometown Elementary School, Sward Elementary School, and Kolmar Avenue Elementary School.
Ownership History
Date
Name
Owned For
Owner Type
Purchase Details
Closed on
Sep 29, 2017
Sold by
Howell Leilani
Bought by
Chicago Title Land Trust Co and Trust Number 8002375697
Current Estimated Value
Purchase Details
Closed on
Aug 9, 2017
Sold by
Lightfoot Jonathan
Bought by
Howell Leilani
Purchase Details
Closed on
Jul 12, 2013
Sold by
Talley Fannie H
Bought by
Lightfoot Jonathan D
Purchase Details
Closed on
Aug 23, 2010
Sold by
Bolanos Jose M
Bought by
Talley Fannie H
Home Financials for this Owner
Home Financials are based on the most recent Mortgage that was taken out on this home.
Original Mortgage
$140,400
Interest Rate
4.54%
Mortgage Type
New Conventional
Purchase Details
Closed on
May 15, 2001
Sold by
Bolanos Esmeralda S
Bought by
Bolanos Jose M
Create a Home Valuation Report for This Property
The Home Valuation Report is an in-depth analysis detailing your home's value as well as a comparison with similar homes in the area
Home Values in the Area
Average Home Value in this Area
Purchase History
| Date | Buyer | Sale Price | Title Company |
|---|---|---|---|
| Chicago Title Land Trust Co | -- | Chicago Title Land Trust Com | |
| Howell Leilani | -- | Attorney | |
| Lightfoot Jonathan D | -- | None Available | |
| Talley Fannie H | $156,000 | Pntn | |
| Bolanos Jose M | -- | -- |
Source: Public Records
Mortgage History
| Date | Status | Borrower | Loan Amount |
|---|---|---|---|
| Previous Owner | Talley Fannie H | $140,400 |
Source: Public Records
Tax History Compared to Growth
Tax History
| Year | Tax Paid | Tax Assessment Tax Assessment Total Assessment is a certain percentage of the fair market value that is determined by local assessors to be the total taxable value of land and additions on the property. | Land | Improvement |
|---|---|---|---|---|
| 2024 | $5,747 | $18,790 | $1,546 | $17,244 |
| 2023 | $5,601 | $18,790 | $1,546 | $17,244 |
| 2022 | $5,601 | $14,789 | $1,650 | $13,139 |
| 2021 | $5,478 | $14,787 | $1,649 | $13,138 |
| 2020 | $5,368 | $14,787 | $1,649 | $13,138 |
| 2019 | $6,213 | $17,132 | $1,494 | $15,638 |
| 2018 | $5,977 | $17,132 | $1,494 | $15,638 |
| 2017 | $5,987 | $17,132 | $1,494 | $15,638 |
| 2016 | $5,202 | $14,200 | $1,237 | $12,963 |
| 2015 | $5,145 | $14,200 | $1,237 | $12,963 |
| 2014 | $5,087 | $14,200 | $1,237 | $12,963 |
| 2013 | $2,899 | $13,517 | $1,237 | $12,280 |
Source: Public Records
Map
Nearby Homes
- 4009 W 93rd Place Unit 4B
- 4025 W 93rd Place Unit 1E
- 9226 S Harding Ave
- 9620 S Kedvale Ave Unit 201E
- 9132 S Pulaski Rd Unit 2W
- 9321 S Avers Ave
- 3900 W 95th St Unit 303
- 9221 S Avers Ave
- 9338 S Ridgeway Ave
- 4211 W 95th St Unit 1C
- 9601 S Karlov Ave Unit 104
- 4049 W 89th Place
- 9428 S Lawndale Ave
- 8925 S Komensky Ave
- 4153 W 89th Place Unit 1
- 8928 S Ryan Rd
- 9516 S Kildare Ave Unit 2N
- 9451 S Lawndale Ave
- 9652 S Harding Ave
- 8918 S Ryan Rd
- 4005 W 93rd St Unit 4B
- 4005 W 93rd St Unit 3E
- 4005 W 93rd St Unit 2B
- 4005 W 93rd St Unit 2C
- 4005 W 93rd St Unit 3B
- 4005 W 93rd St Unit 2D
- 4005 W 93rd St Unit 2A
- 4005 W 93rd St Unit 3D
- 4005 W 93rd St Unit 4C
- 4005 W 93rd St Unit 3C
- 4005 W 93rd St Unit 3A
- 4005 W 93rd St Unit 4A
- 4005 W 93rd St Unit 4D
- 4005 W 93rd St Unit 2E
- 4015 W 93rd St Unit 4015D
- 4015 W 93rd St Unit 4015B
- 4015 W 93rd St Unit 4015A
- 4015 W 93rd St Unit 4015C
- 4015 W 93rd St Unit 1E
- 4015 W 93rd St Unit 2-E