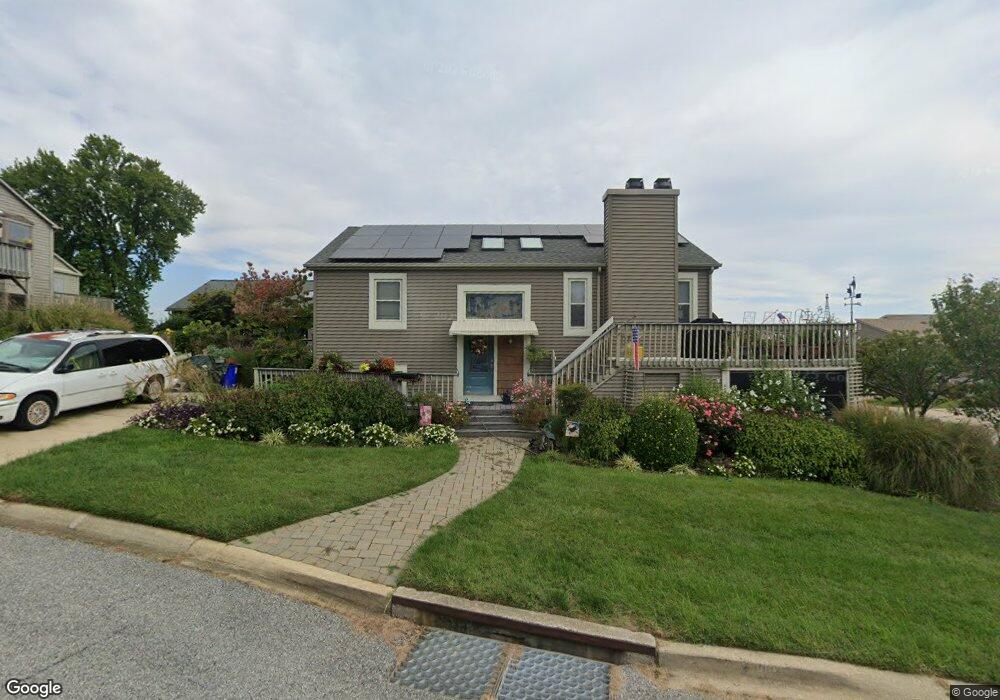
4006 Carousel Way Chesapeake Beach, MD 20732
Estimated Value: $626,262 - $724,000
3
Beds
2
Baths
1,002
Sq Ft
$670/Sq Ft
Est. Value
About This Home
This home is located at 4006 Carousel Way, Chesapeake Beach, MD 20732 and is currently estimated at $671,066, approximately $669 per square foot. 4006 Carousel Way is a home located in Calvert County with nearby schools including Beach Elementary School, Windy Hill Middle School, and Northern High School.
Ownership History
Date
Name
Owned For
Owner Type
Purchase Details
Closed on
Oct 14, 2008
Sold by
Johnson Barbara
Bought by
Pritchard Charles P
Current Estimated Value
Home Financials for this Owner
Home Financials are based on the most recent Mortgage that was taken out on this home.
Original Mortgage
$352,000
Outstanding Balance
$234,746
Interest Rate
6.49%
Mortgage Type
Purchase Money Mortgage
Estimated Equity
$436,320
Purchase Details
Closed on
Jul 25, 2008
Sold by
Johnson Barbara
Bought by
Pritchard Charles P
Home Financials for this Owner
Home Financials are based on the most recent Mortgage that was taken out on this home.
Original Mortgage
$352,000
Interest Rate
6.49%
Mortgage Type
Purchase Money Mortgage
Purchase Details
Closed on
Jun 3, 2004
Sold by
Bealor Shirley E
Bought by
Johnson Barbara and Mcgovern Jacqueline R
Purchase Details
Closed on
Nov 28, 2000
Sold by
Milanese Hugh
Bought by
Bealor Shirley E and Henderson Elizabeth
Create a Home Valuation Report for This Property
The Home Valuation Report is an in-depth analysis detailing your home's value as well as a comparison with similar homes in the area
Home Values in the Area
Average Home Value in this Area
Purchase History
| Date | Buyer | Sale Price | Title Company |
|---|---|---|---|
| Pritchard Charles P | $440,000 | -- | |
| Pritchard Charles P | $440,000 | -- | |
| Johnson Barbara | $346,000 | -- | |
| Bealor Shirley E | $225,000 | -- |
Source: Public Records
Mortgage History
| Date | Status | Borrower | Loan Amount |
|---|---|---|---|
| Open | Pritchard Charles P | $352,000 | |
| Previous Owner | Pritchard Charles P | $352,000 | |
| Closed | Bealor Shirley E | -- |
Source: Public Records
Tax History Compared to Growth
Tax History
| Year | Tax Paid | Tax Assessment Tax Assessment Total Assessment is a certain percentage of the fair market value that is determined by local assessors to be the total taxable value of land and additions on the property. | Land | Improvement |
|---|---|---|---|---|
| 2025 | $4,307 | $398,300 | $165,800 | $232,500 |
| 2024 | $4,128 | $381,567 | $0 | $0 |
| 2023 | $3,805 | $364,833 | $0 | $0 |
| 2022 | $3,698 | $348,100 | $165,800 | $182,300 |
| 2021 | $3,513 | $336,167 | $0 | $0 |
| 2020 | $3,513 | $324,233 | $0 | $0 |
| 2019 | $3,428 | $312,300 | $165,800 | $146,500 |
| 2018 | $3,382 | $307,700 | $0 | $0 |
| 2017 | $3,393 | $303,100 | $0 | $0 |
| 2016 | -- | $298,500 | $0 | $0 |
| 2015 | $3,495 | $298,500 | $0 | $0 |
| 2014 | $3,495 | $298,500 | $0 | $0 |
Source: Public Records
Map
Nearby Homes
- 0 10th St
- 3728 Maryland 260
- 3620 27th St
- 3709 29th St
- 7410 Dakota Ave
- 8410 Clear Spring Dr Unit 1
- 8049 Forest Ridge Dr Unit 3
- 3420 Mary Lou Ln
- 3645 Bedford Dr
- 3761 Bedford Dr
- 9000 Bay Ave Unit 401 & 402
- 8910 Louisville Ave
- 3837 3rd St
- 8922 Louisville Ave
- 4000 Chesapeake Ave
- 3936 5th St
- 9101 Greenwood Ave
- 2425 Woodland Ct
- 6585 11th St
- 3932 6th St
- 7784 Dentzell Ct
- 4004 Carousel Way
- 4005 Carousel Way
- 7786 Dentzell Ct
- 4002 Carousel Way
- 4007 Carousel Way
- 7781 Dentzel Ct
- 7781 Dentzell Ct
- 7788 Dentzell Ct
- 7783 Dentzell Ct
- 7790 Dentzell Ct
- 4009 Carousel Way
- 4010 Carousel Way
- 4001 Carousel Way
- 7785 Dentzell Ct
- 7739 C St
- 4003 Carousel Way
- 7787 Dentzell Ct
- 4000 Carousel Way
- 7737 C St