Estimated Value: $534,913 - $589,000
6
Beds
3
Baths
2,906
Sq Ft
$193/Sq Ft
Est. Value
About This Home
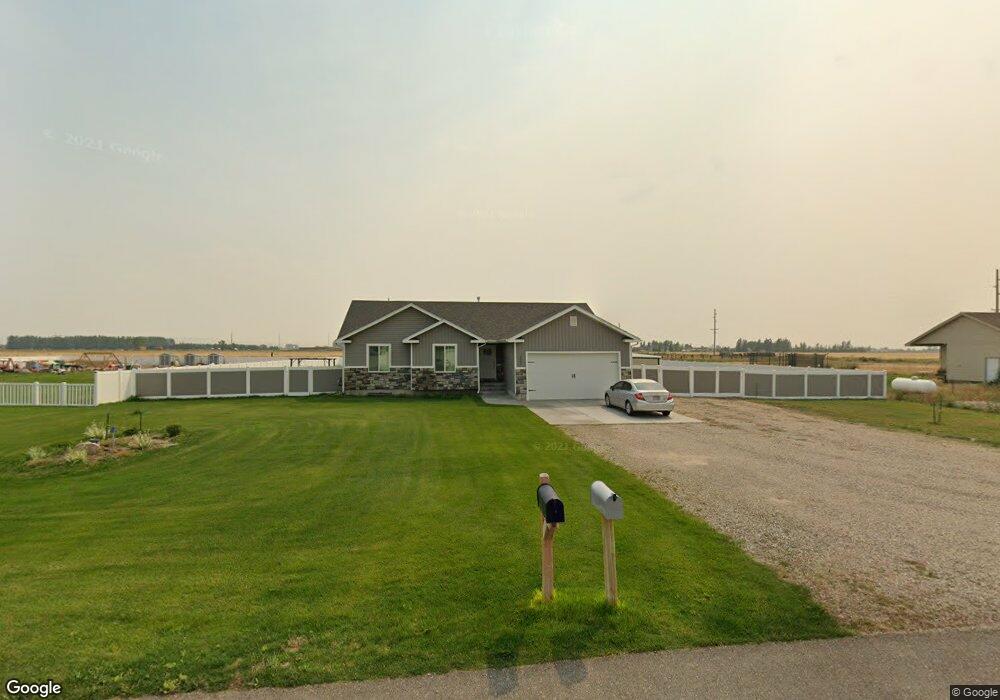
This home is located at 4006 E 54 N, Rigby, ID 83442 and is currently estimated at $561,957, approximately $193 per square foot. 4006 E 54 N is a home located in Jefferson County with nearby schools including Jefferson Elementary School, Rigby Middle School, and Rigby High School.
Ownership History
Date
Name
Owned For
Owner Type
Purchase Details
Closed on
Aug 26, 2019
Sold by
Bowen E Ray and Bowen Valerie
Bought by
Adams Trevor and Adams Mindi
Current Estimated Value
Home Financials for this Owner
Home Financials are based on the most recent Mortgage that was taken out on this home.
Original Mortgage
$308,080
Outstanding Balance
$270,405
Interest Rate
3.7%
Mortgage Type
New Conventional
Estimated Equity
$291,552
Purchase Details
Closed on
Jun 15, 2017
Sold by
Stonericige Construction Llc
Bought by
Bowen E Ray and Bowen Valerie
Home Financials for this Owner
Home Financials are based on the most recent Mortgage that was taken out on this home.
Original Mortgage
$257,575
Interest Rate
4.02%
Mortgage Type
New Conventional
Purchase Details
Closed on
Dec 1, 2016
Sold by
D & D Price Investments Llc
Bought by
Stoneridge Construction
Purchase Details
Closed on
Aug 17, 2012
Sold by
Mountain West Construction
Bought by
Jefferson County
Create a Home Valuation Report for This Property
The Home Valuation Report is an in-depth analysis detailing your home's value as well as a comparison with similar homes in the area
Home Values in the Area
Average Home Value in this Area
Purchase History
| Date | Buyer | Sale Price | Title Company |
|---|---|---|---|
| Adams Trevor | -- | First American Title Rigby | |
| Bowen E Ray | -- | Amerititle | |
| Stoneridge Construction | -- | First American Title Rigby | |
| Jefferson County | -- | None Available |
Source: Public Records
Mortgage History
| Date | Status | Borrower | Loan Amount |
|---|---|---|---|
| Open | Adams Trevor | $308,080 | |
| Previous Owner | Bowen E Ray | $257,575 |
Source: Public Records
Tax History Compared to Growth
Tax History
| Year | Tax Paid | Tax Assessment Tax Assessment Total Assessment is a certain percentage of the fair market value that is determined by local assessors to be the total taxable value of land and additions on the property. | Land | Improvement |
|---|---|---|---|---|
| 2024 | $1,521 | $473,261 | $0 | $0 |
| 2023 | $1,521 | $483,805 | $0 | $0 |
| 2022 | $2,055 | $413,194 | $0 | $0 |
| 2021 | $1,889 | $323,603 | $0 | $0 |
| 2020 | $1,570 | $298,841 | $0 | $0 |
| 2019 | $1,699 | $264,144 | $0 | $0 |
| 2018 | $1,462 | $232,229 | $0 | $0 |
| 2017 | $235 | $118,578 | $0 | $0 |
| 2016 | $6 | $510 | $0 | $0 |
| 2015 | $4 | $379 | $0 | $0 |
| 2014 | $4 | $379 | $0 | $0 |
| 2013 | -- | $379 | $0 | $0 |
Source: Public Records
Map
Nearby Homes
- 115 N 3962 E
- 14050 N 65th E
- 17 N 3928 E
- 88 N 3900 E
- 4106 E 67 N
- 3919 E 116 N
- 160 N 4032 E
- 3918 E 144 N
- 3878 Walnut Way
- Xavier Plan at Pepperwood Crossing
- Vanbrough Plan at Pepperwood Crossing
- Westbrook Plan at Pepperwood Crossing
- Stanton Plan at Pepperwood Crossing
- Townsend Plan at Pepperwood Crossing
- Somerley Plan at Pepperwood Crossing
- Northfield Plan at Pepperwood Crossing
- Leighton Plan at Pepperwood Crossing
- Knighton Plan at Pepperwood Crossing
- Milton Plan at Pepperwood Crossing
- Norfolk Plan at Pepperwood Crossing