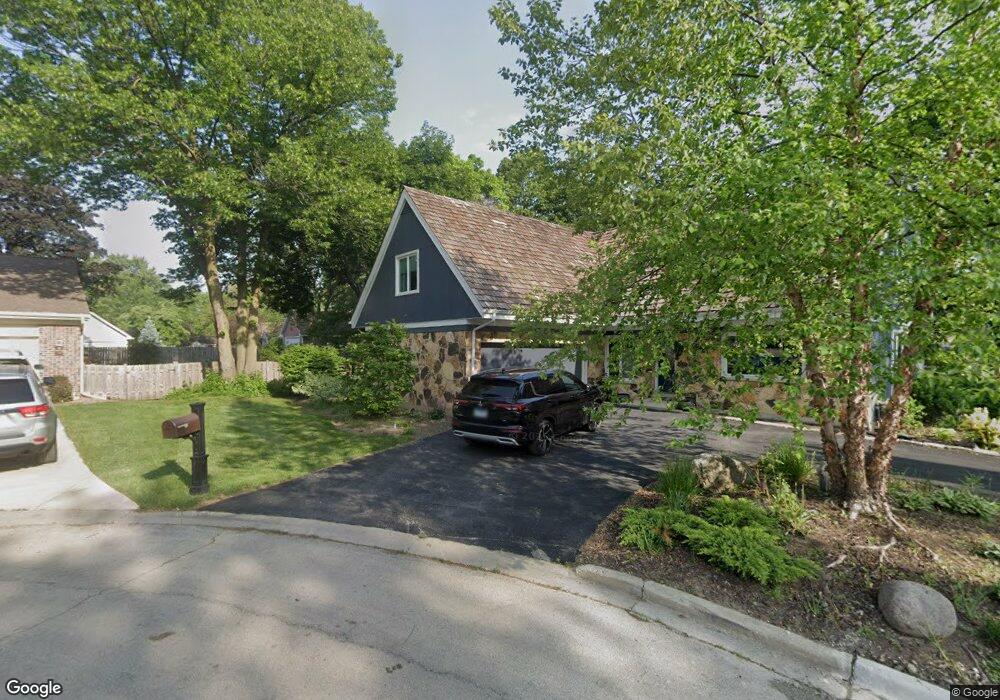
4006 Walnut Ct Rolling Meadows, IL 60008
Creekside NeighborhoodEstimated Value: $494,000 - $682,000
4
Beds
3
Baths
2,140
Sq Ft
$269/Sq Ft
Est. Value
About This Home
This home is located at 4006 Walnut Ct, Rolling Meadows, IL 60008 and is currently estimated at $575,965, approximately $269 per square foot. 4006 Walnut Ct is a home located in Cook County with nearby schools including Central Road Elementary School, Plum Grove Jr High School, and William Fremd High School.
Ownership History
Date
Name
Owned For
Owner Type
Purchase Details
Closed on
Jun 6, 2017
Sold by
Proskin Michael R
Bought by
Mascari John
Current Estimated Value
Purchase Details
Closed on
May 1, 2017
Sold by
Proskin Michael R
Bought by
Mascari John
Purchase Details
Closed on
Apr 1, 2017
Sold by
Proskin Robert J and Proskin Michael R
Bought by
Proskin Michael R and The Proskin Irrevocable Trust
Purchase Details
Closed on
Oct 1, 2007
Sold by
Proskin Robert J and Proskin Lucille M
Bought by
Proskin Robert J and Proskin Lucille M
Purchase Details
Closed on
Jan 4, 1995
Sold by
Pajerski Adam S and Pajerski Maureen A
Bought by
Proskin Robert J and Proskin Lucille M
Home Financials for this Owner
Home Financials are based on the most recent Mortgage that was taken out on this home.
Original Mortgage
$80,000
Interest Rate
9.12%
Create a Home Valuation Report for This Property
The Home Valuation Report is an in-depth analysis detailing your home's value as well as a comparison with similar homes in the area
Home Values in the Area
Average Home Value in this Area
Purchase History
We collect this data history from publicly available records. To have your information removed, we recommend requesting removal directly through your county’s website.
| Date | Buyer | Sale Price | Title Company |
|---|---|---|---|
| Mascari John | $347,500 | Chicago Title Company | |
| Mascari John | $347,500 | Chicago Title Company | |
| Proskin Michael R | -- | None Available | |
| Proskin Robert J | -- | None Available | |
| Proskin Robert J | $239,000 | Attorneys Natl Title Network |
Source: Public Records
Mortgage History
We collect this data history from publicly available records. To have your information removed, we recommend requesting removal directly through your county’s website.
| Date | Status | Borrower | Loan Amount |
|---|---|---|---|
| Previous Owner | Proskin Robert J | $80,000 |
Source: Public Records
Tax History
| Year | Tax Paid | Tax Assessment Tax Assessment Total Assessment is a certain percentage of the fair market value that is determined by local assessors to be the total taxable value of land and additions on the property. | Land | Improvement |
|---|---|---|---|---|
| 2025 | $12,629 | $52,000 | $5,746 | $46,254 |
| 2024 | $12,629 | $32,804 | $4,862 | $27,942 |
| 2023 | $12,159 | $40,000 | $4,862 | $35,138 |
| 2022 | $12,159 | $40,000 | $4,862 | $35,138 |
| 2021 | $12,460 | $36,448 | $3,094 | $33,354 |
| 2020 | $12,262 | $36,448 | $3,094 | $33,354 |
| 2019 | $12,314 | $40,724 | $3,094 | $37,630 |
| 2018 | $13,614 | $40,663 | $2,873 | $37,790 |
| 2017 | $13,335 | $40,663 | $2,873 | $37,790 |
| 2016 | $11,105 | $40,663 | $2,873 | $37,790 |
| 2015 | $10,798 | $33,093 | $2,652 | $30,441 |
| 2014 | $5,330 | $33,093 | $2,652 | $30,441 |
| 2013 | $5,322 | $33,093 | $2,652 | $30,441 |
Source: Public Records
Map
Nearby Homes
- 3946 Balmoral Ct Unit 6
- 3107 Falcon Ct W
- 3100 Falcon Ct W
- 2 Dogwood Rd
- 3204 Owl Dr
- 2600 Brookwood Way Dr Unit 114
- 2600 Brookwood Way Dr Unit 206
- 3000 California Ave
- 3265 Kirchoff Rd Unit 127
- 3265 Kirchoff Rd Unit 116
- 503 Lexington Ln
- 409 Lexington Ln
- 305 Lexington Ln
- 2814 Cardinal Dr
- 3135 Town Square Dr Unit 104
- 2401 Rohlwing Rd
- 4795 Woodcliff Ln
- 4277 Wilson Ave
- 3000 Starling Ln
- 2539 Geranium Way
- 3948 Balmoral Ct
- 3950 Balmoral Ct
- 3950 Balmoral Ct Unit A
- 3944 Balmoral Ct
- 3942 Balmoral Ct
- 3940 Balmoral Ct Unit 6
- 4 Calchester on Auburn
- 3938 Balmoral Ct Unit 6
- 3 Kittery on Auburn
- 8 Hampton on Auburn
- 3936 Balmoral Ct
- 3934 Balmoral Ct
- 4002 Walnut Ct
- 1 Calchester on Auburn
- 4 Kittery on Auburn
- 2 Calchester on Auburn
- 4010 Walnut Ct
- 3932 Balmoral Ct
- 6 Hampton on Auburn
- 1 Kittery on Auburn
Your Personal Tour Guide
Ask me questions while you tour the home.