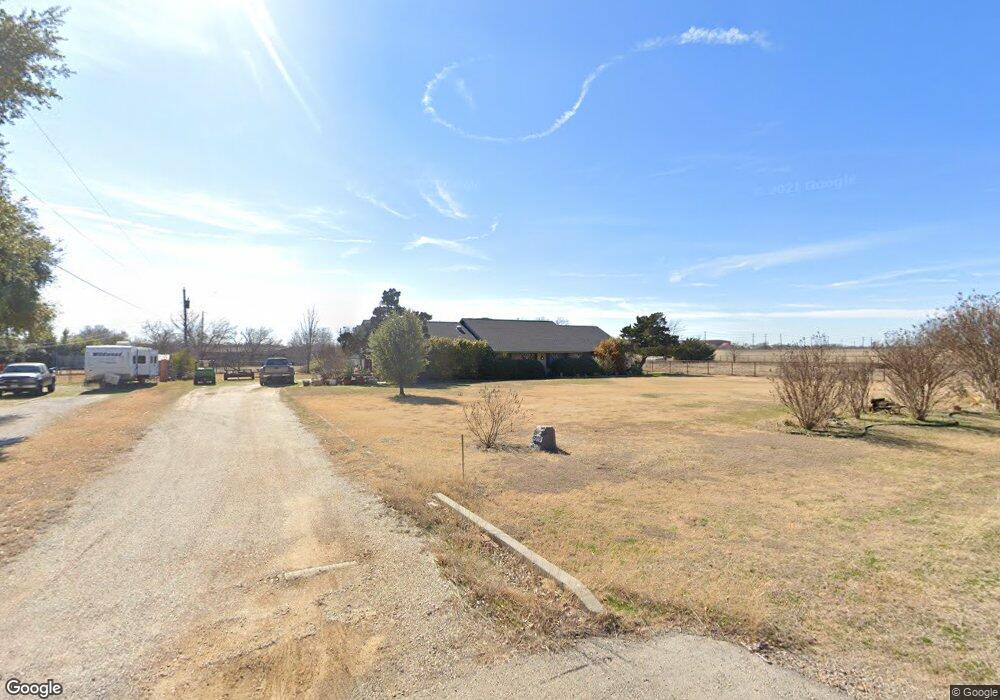
4007 Lariat Rd Denton, TX 76207
Estimated Value: $377,527 - $583,000
3
Beds
2
Baths
2,243
Sq Ft
$211/Sq Ft
Est. Value
About This Home
This home is located at 4007 Lariat Rd, Denton, TX 76207 and is currently estimated at $473,632, approximately $211 per square foot. 4007 Lariat Rd is a home located in Denton County with nearby schools including Evers Park Elementary School, Calhoun Middle School, and Denton High School.
Ownership History
Date
Name
Owned For
Owner Type
Purchase Details
Closed on
Jun 11, 2024
Sold by
Mcreynolds Glen Harold
Bought by
Mcreynolds Jessica Marie and Davis John Freeman
Current Estimated Value
Home Financials for this Owner
Home Financials are based on the most recent Mortgage that was taken out on this home.
Original Mortgage
$360,000
Outstanding Balance
$355,579
Interest Rate
7.22%
Mortgage Type
New Conventional
Estimated Equity
$118,053
Purchase Details
Closed on
Jun 2, 2023
Sold by
Mcreynolds Jackie Marie Vinson
Bought by
Mcreynolds Glen Harold
Purchase Details
Closed on
Apr 29, 1996
Sold by
Smith Robert C and Smith Patricia E
Bought by
Mcreynolds Glen H and Mcreynolds Jackie M
Home Financials for this Owner
Home Financials are based on the most recent Mortgage that was taken out on this home.
Original Mortgage
$124,000
Interest Rate
7.8%
Create a Home Valuation Report for This Property
The Home Valuation Report is an in-depth analysis detailing your home's value as well as a comparison with similar homes in the area
Home Values in the Area
Average Home Value in this Area
Purchase History
| Date | Buyer | Sale Price | Title Company |
|---|---|---|---|
| Mcreynolds Jessica Marie | -- | None Listed On Document | |
| Mcreynolds Glen Harold | -- | None Listed On Document | |
| Mcreynolds Glen Harold | -- | None Listed On Document | |
| Mcreynolds Glen H | -- | -- |
Source: Public Records
Mortgage History
| Date | Status | Borrower | Loan Amount |
|---|---|---|---|
| Open | Mcreynolds Jessica Marie | $360,000 | |
| Previous Owner | Mcreynolds Glen H | $124,000 |
Source: Public Records
Tax History Compared to Growth
Tax History
| Year | Tax Paid | Tax Assessment Tax Assessment Total Assessment is a certain percentage of the fair market value that is determined by local assessors to be the total taxable value of land and additions on the property. | Land | Improvement |
|---|---|---|---|---|
| 2025 | $1,441 | $308,671 | $166,619 | $142,052 |
| 2024 | $4,928 | $255,288 | $0 | $0 |
| 2023 | $1,441 | $232,080 | $164,461 | $191,106 |
| 2022 | $4,479 | $210,982 | $101,519 | $169,217 |
| 2021 | $4,264 | $191,802 | $67,120 | $124,682 |
| 2020 | $4,491 | $196,484 | $67,120 | $129,364 |
| 2019 | $4,799 | $201,116 | $67,120 | $133,996 |
| 2018 | $4,910 | $203,269 | $67,120 | $136,149 |
| 2017 | $5,152 | $208,415 | $67,120 | $141,295 |
| 2016 | $4,867 | $196,900 | $67,120 | $132,880 |
| 2015 | $2,857 | $179,000 | $55,774 | $123,226 |
| 2013 | -- | $160,215 | $47,407 | $112,808 |
Source: Public Records
Map
Nearby Homes
- 2001 N Lariat Rd
- 2007 Cindy Ln
- 1401 N Masch Branch Rd
- 0000 Mesa Dr
- 2908 Lakewood Dr
- 2905 Lakewood Dr
- 2112 Carriage Hill
- 2816 Westglen Dr
- 1155 Cottonwood Ln
- 2501 Payne Dr
- 2204 Crestmeadow St
- 8540 W University Dr
- 2225 Southway
- 2516 Bauer Dr
- 3211 Darby Ln
- 2320 Southway
- 328 Broken Bow
- ESTERO Plan at Hickory Grove
- EASTON Plan at Hickory Grove
- DALTON Plan at Hickory Grove
- 4001 Lariat Rd
- 1901 N Lariat Rd
- 3919 Lariat Rd
- 1907 N Lariat Rd
- 1900 N Lariat Rd
- 1906 N Lariat Rd
- 1913 N Lariat Rd
- 1912 N Lariat Rd
- 4718 W University Dr
- 1919 N Lariat Rd
- 3906 Lariat Rd
- 1918 N Lariat Rd
- 3901 Lariat Rd
- 3900 Lariat Rd
- 3921 W University Dr
- 3819 W University Dr
- 1907 Cindy Ln
- 2000 N Lariat Rd
- 2007 N Lariat Rd
- 3819 Lariat Rd