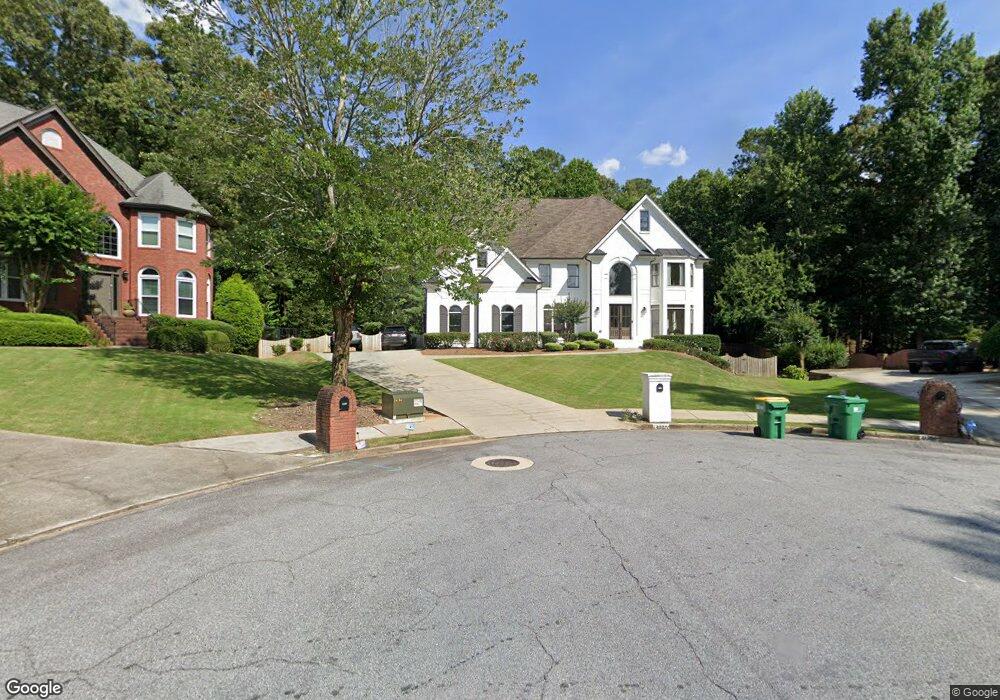
4007 Yellow Ginger Point Unit VIII Norcross, GA 30092
Estimated Value: $981,022 - $1,138,000
5
Beds
4
Baths
4,169
Sq Ft
$252/Sq Ft
Est. Value
About This Home
This home is located at 4007 Yellow Ginger Point Unit VIII, Norcross, GA 30092 and is currently estimated at $1,048,506, approximately $251 per square foot. 4007 Yellow Ginger Point Unit VIII is a home located in Gwinnett County with nearby schools including Simpson Elementary School, Pinckneyville Middle School, and Norcross High School.
Ownership History
Date
Name
Owned For
Owner Type
Purchase Details
Closed on
Aug 3, 2020
Sold by
Sheridan Sean W
Bought by
Serr Chelsea Breanna and Serr Kayla Ruffin
Current Estimated Value
Home Financials for this Owner
Home Financials are based on the most recent Mortgage that was taken out on this home.
Original Mortgage
$510,400
Outstanding Balance
$452,761
Interest Rate
3%
Mortgage Type
New Conventional
Estimated Equity
$595,745
Purchase Details
Closed on
Aug 20, 1999
Sold by
Straka Philip J and Straka Joane E
Bought by
Sehgal Sanjay and Sehgal Geeta
Home Financials for this Owner
Home Financials are based on the most recent Mortgage that was taken out on this home.
Original Mortgage
$305,600
Interest Rate
7.73%
Mortgage Type
New Conventional
Purchase Details
Closed on
Jun 12, 1998
Sold by
Bill Stark Properties Inc
Bought by
Straka Philip J and Straka Joane E
Home Financials for this Owner
Home Financials are based on the most recent Mortgage that was taken out on this home.
Original Mortgage
$274,800
Interest Rate
7.37%
Mortgage Type
New Conventional
Create a Home Valuation Report for This Property
The Home Valuation Report is an in-depth analysis detailing your home's value as well as a comparison with similar homes in the area
Home Values in the Area
Average Home Value in this Area
Purchase History
| Date | Buyer | Sale Price | Title Company |
|---|---|---|---|
| Serr Chelsea Breanna | $675,000 | -- | |
| Sehgal Sanjay | $382,500 | -- | |
| Straka Philip J | $343,600 | -- |
Source: Public Records
Mortgage History
| Date | Status | Borrower | Loan Amount |
|---|---|---|---|
| Open | Serr Chelsea Breanna | $510,400 | |
| Closed | Serr Chelsea Breanna | $97,032 | |
| Previous Owner | Sehgal Sanjay | $305,600 | |
| Previous Owner | Straka Philip J | $274,800 |
Source: Public Records
Tax History Compared to Growth
Tax History
| Year | Tax Paid | Tax Assessment Tax Assessment Total Assessment is a certain percentage of the fair market value that is determined by local assessors to be the total taxable value of land and additions on the property. | Land | Improvement |
|---|---|---|---|---|
| 2024 | $10,759 | $342,840 | $67,600 | $275,240 |
| 2023 | $10,759 | $348,200 | $67,600 | $280,600 |
| 2022 | $10,070 | $308,440 | $62,000 | $246,440 |
| 2021 | $9,021 | $249,560 | $44,000 | $205,560 |
| 2020 | $9,297 | $249,560 | $44,000 | $205,560 |
| 2019 | $8,944 | $249,560 | $44,000 | $205,560 |
| 2018 | $8,976 | $249,560 | $44,000 | $205,560 |
| 2016 | $8,133 | $226,720 | $40,000 | $186,720 |
| 2015 | $7,705 | $211,600 | $36,000 | $175,600 |
| 2014 | -- | $211,600 | $36,000 | $175,600 |
Source: Public Records
Map
Nearby Homes
- 5201 Edgerton Dr
- 0 Medlock Bridge Rd Unit 7311679
- 5018 Wickford Dr
- 5062 Bridgeport Ln
- Olmstead Plan at Town Center Overlook
- Lynnwood Plan at Town Center Overlook
- 5064 Insperon Ln Unit 34
- 3875 Ancroft Cir
- 4860 Bush Rd
- 4188 Riverview Dr
- 5206 Creek Walk Cir
- 5440 Clinchfield Trail
- 4915 Millers Trace
- 5067 Audley Ln
- 4611 Medlock Bridge Rd
- 565 Marsh Park Dr
- 4916 Sudbrook Way Unit 253
- The Adams Plan at Waterside - Condos
- 4457 Watervale Way Unit 292
- 4477 Watervale Way Unit 286
- 4006 Yellow Ginger Point Unit VIII
- 4017 Yellow Ginger Point Unit VIII
- 4027 Yellow Ginger Point
- 4027 Yellow Ginger Point Unit 839
- 5120 Wild Ginger Cove
- 0 Yellow Ginger Point Unit 7423327
- 0 Yellow Ginger Point Unit 839
- 4011 Yarrow Bluff Unit VIII
- 5130 Wild Ginger Cove
- 5000 Wild Ginger Cove
- 5110 Wild Ginger Cove Unit VIII
- 5140 Wild Ginger Cove Unit 8
- 5010 Wild Ginger Cove
- 4001 Yarrow Bluff Unit 847
- 4001 Yarrow Bluff
- 5005 Wild Ginger Cove
- 5100 Wild Ginger Cove Unit 8
- 5020 Wild Ginger Cove Unit VIII
- 5125 Wild Ginger Cove Unit VIII
- 5135 Wild Ginger Cove