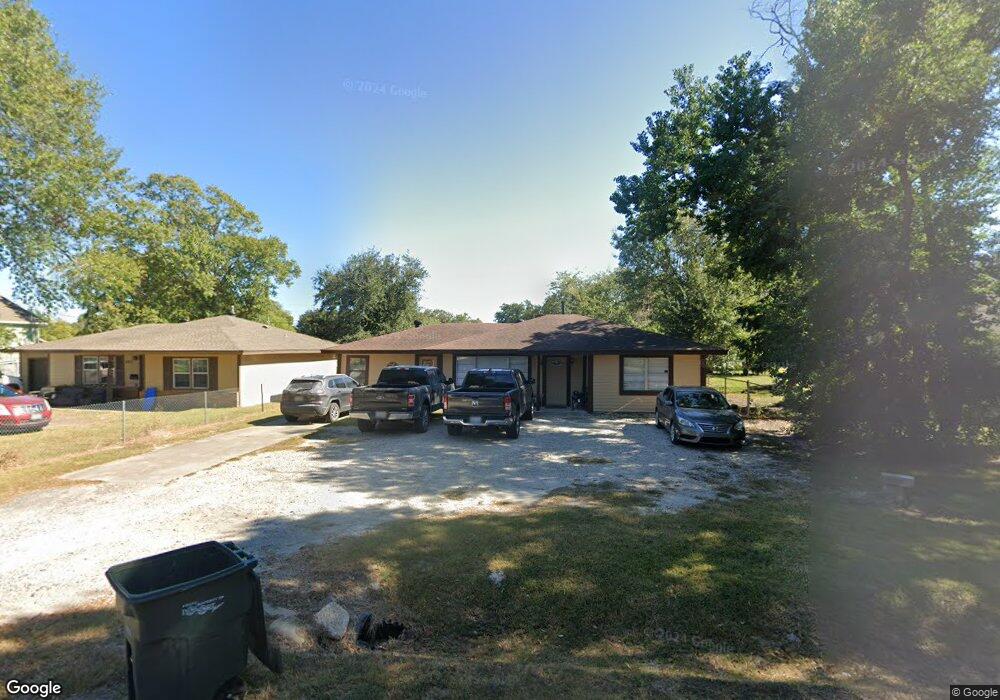
4008 Donald St Port Arthur, TX 77642
Estimated Value: $86,000 - $126,000
7
Beds
3
Baths
1,800
Sq Ft
$63/Sq Ft
Est. Value
About This Home
This home is located at 4008 Donald St, Port Arthur, TX 77642 and is currently estimated at $114,276, approximately $63 per square foot. 4008 Donald St is a home located in Jefferson County with nearby schools including Travis Elementary School, Jefferson Middle School, and Memorial High School.
Ownership History
Date
Name
Owned For
Owner Type
Purchase Details
Closed on
Dec 26, 2022
Sold by
Barrera Jose Adrian Bonilla
Bought by
Barrera Esteban A
Current Estimated Value
Home Financials for this Owner
Home Financials are based on the most recent Mortgage that was taken out on this home.
Original Mortgage
$132,554
Outstanding Balance
$128,799
Interest Rate
7.08%
Mortgage Type
FHA
Estimated Equity
-$14,523
Purchase Details
Closed on
Feb 19, 2018
Sold by
Kersee Derick Jerome
Bought by
Barrera Jose Bonilla and Bonilla Elsy Miladez Morrera
Purchase Details
Closed on
Nov 7, 2017
Sold by
Allen Kimberly Elizabeth and Jefferson County
Bought by
Kersee Derick Jerome
Purchase Details
Closed on
Nov 1, 2016
Sold by
Allen Kimberly Elizabeth
Bought by
County Of Jefferson
Create a Home Valuation Report for This Property
The Home Valuation Report is an in-depth analysis detailing your home's value as well as a comparison with similar homes in the area
Home Values in the Area
Average Home Value in this Area
Purchase History
| Date | Buyer | Sale Price | Title Company |
|---|---|---|---|
| Barrera Esteban A | -- | Capital Title | |
| Barrera Jose Bonilla | -- | None Available | |
| Kersee Derick Jerome | $7,300 | None Available | |
| County Of Jefferson | $15,402 | None Available |
Source: Public Records
Mortgage History
| Date | Status | Borrower | Loan Amount |
|---|---|---|---|
| Open | Barrera Esteban A | $132,554 | |
| Closed | Barrera Esteban A | $5,302 |
Source: Public Records
Tax History Compared to Growth
Tax History
| Year | Tax Paid | Tax Assessment Tax Assessment Total Assessment is a certain percentage of the fair market value that is determined by local assessors to be the total taxable value of land and additions on the property. | Land | Improvement |
|---|---|---|---|---|
| 2025 | $1,594 | $125,368 | -- | -- |
| 2024 | $1,594 | $113,971 | -- | -- |
| 2023 | $1,594 | $103,610 | $3,007 | $100,603 |
| 2022 | $2,160 | $68,013 | $3,007 | $65,006 |
| 2021 | $973 | $29,354 | $3,007 | $26,347 |
| 2020 | $922 | $27,827 | $3,007 | $24,820 |
| 2019 | $848 | $26,170 | $3,010 | $23,160 |
| 2018 | $834 | $26,170 | $3,010 | $23,160 |
| 2017 | $0 | $41,620 | $3,010 | $38,610 |
| 2016 | $1,219 | $41,620 | $3,010 | $38,610 |
| 2015 | $1,242 | $41,620 | $3,010 | $38,610 |
| 2014 | $1,242 | $41,620 | $3,010 | $38,610 |
Source: Public Records
Map
Nearby Homes