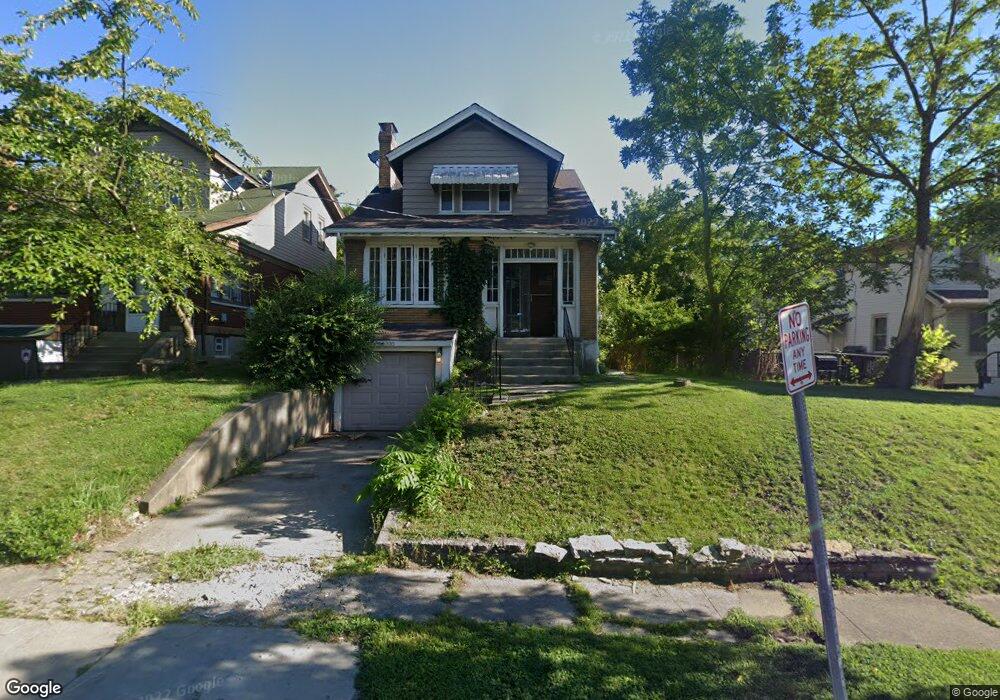
4008 Jamestown St Cincinnati, OH 45205
West Price Hill NeighborhoodEstimated Value: $126,000 - $136,086
2
Beds
2
Baths
1,170
Sq Ft
$112/Sq Ft
Est. Value
About This Home
This home is located at 4008 Jamestown St, Cincinnati, OH 45205 and is currently estimated at $131,272, approximately $112 per square foot. 4008 Jamestown St is a home located in Hamilton County with nearby schools including Carson School, Gilbert A. Dater High School, and Western Hills High School.
Ownership History
Date
Name
Owned For
Owner Type
Purchase Details
Closed on
Jul 19, 2007
Sold by
Bank Of New York
Bought by
Alf Taye
Current Estimated Value
Purchase Details
Closed on
Dec 13, 2006
Sold by
Raike James and Raike Melissa
Bought by
Bank Of New York and Certificateholders Of Cwabs 2005-01 Inc
Purchase Details
Closed on
Mar 9, 2005
Sold by
Brauer Michelle R and Brauer Bernard J
Bought by
Raike James and Raike Melissa
Home Financials for this Owner
Home Financials are based on the most recent Mortgage that was taken out on this home.
Original Mortgage
$90,950
Interest Rate
8.87%
Mortgage Type
New Conventional
Purchase Details
Closed on
Sep 24, 1999
Sold by
Rosenberger Mary J
Bought by
Brauer Michelle R
Home Financials for this Owner
Home Financials are based on the most recent Mortgage that was taken out on this home.
Original Mortgage
$61,500
Interest Rate
7.83%
Mortgage Type
Balloon
Create a Home Valuation Report for This Property
The Home Valuation Report is an in-depth analysis detailing your home's value as well as a comparison with similar homes in the area
Home Values in the Area
Average Home Value in this Area
Purchase History
| Date | Buyer | Sale Price | Title Company |
|---|---|---|---|
| Alf Taye | $34,900 | Resource Title Agency Inc | |
| Bank Of New York | $54,000 | None Available | |
| Raike James | $102,000 | Chicago Title Insurance Co | |
| Brauer Michelle R | $76,900 | -- |
Source: Public Records
Mortgage History
| Date | Status | Borrower | Loan Amount |
|---|---|---|---|
| Previous Owner | Raike James | $90,950 | |
| Previous Owner | Brauer Michelle R | $61,500 | |
| Closed | Brauer Michelle R | $15,350 |
Source: Public Records
Tax History Compared to Growth
Tax History
| Year | Tax Paid | Tax Assessment Tax Assessment Total Assessment is a certain percentage of the fair market value that is determined by local assessors to be the total taxable value of land and additions on the property. | Land | Improvement |
|---|---|---|---|---|
| 2024 | $2,140 | $33,698 | $3,381 | $30,317 |
| 2023 | $2,144 | $33,698 | $3,381 | $30,317 |
| 2022 | $1,150 | $16,185 | $3,357 | $12,828 |
| 2021 | $1,128 | $16,185 | $3,357 | $12,828 |
| 2020 | $1,131 | $16,185 | $3,357 | $12,828 |
| 2019 | $1,129 | $14,714 | $3,052 | $11,662 |
| 2018 | $1,130 | $14,714 | $3,052 | $11,662 |
| 2017 | $1,088 | $14,714 | $3,052 | $11,662 |
| 2016 | $907 | $11,949 | $3,262 | $8,687 |
| 2015 | $811 | $11,949 | $3,262 | $8,687 |
| 2014 | $816 | $11,949 | $3,262 | $8,687 |
| 2013 | $942 | $13,581 | $3,707 | $9,874 |
Source: Public Records
Map
Nearby Homes
- 1002 Winfield Ave
- 904 Rosemont Ave
- 4309 Westhaven Ave
- 1057 Gilsey Ave
- 4136 Saint Lawrence Ave
- 1113 Gilsey Ave
- 820 Suire Ave
- 928 Harris Ave
- 4041 W 8th St
- 1006 Kreis Ln
- 900 Kreis Ln
- 1213 Texas Ave
- 1026 Schiff Ave
- 1226 Rutledge Ave
- 1227 Texas Ave
- 2403 Glenway Ave
- 1205 Amanda Place
- 3810 St Lawrence Ave
- 1044 Beech Ave
- 1225 Amanda Place
- 943 Rosemont Ave
- 4012 Jamestown St
- 939 Rosemont Ave
- 4016 Jamestown St
- 935 Rosemont Ave
- 4020 Jamestown St
- 1005 Rosemont Ave
- 1002 Winfield Ave Unit 3
- 4024 Jamestown St
- 927 Rosemont Ave
- 1009 Rosemont Ave
- 591 Rosemont Ave
- 4028 Jamestown St
- 923 Rosemont Ave
- 940 Rosemont Ave
- 938 Rosemont Ave
- 1010 Winfield Ave
- 1010 Winfield Ave Unit 5
- 1010 Winfield Ave Unit 1
- 1013 Rosemont Ave